Moving averages are lagging overlays by definition as we use historical data to determine their position on a price chart. But many traders use moving averages as support during periods of trending prices. Personally, my favorite is the 20 period EMA. Obviously, it can't guarantee us support in an uptrend or resistance in a downtrend, but if you follow price action closely, you'll see that it does a nice job of helping to minimize risk. Mitigating risk is paramount to a successful trader. On the AAPL daily chart below, you'll see that the 20 day EMA provides us no help whatsoever during periods of price consolidation. But recently AAPL broke down beneath its 20 day EMA on heavy volume and every attempt to clear that moving average hurdle has failed - so far. I wouldn't consider AAPL as a long candidate until one of two things occurs. Either AAPL clears its 20 day EMA resistance on heavy volume or a positive divergence prints on the MACD on its next new closing low. For now, ride the downtrend. Check it out:
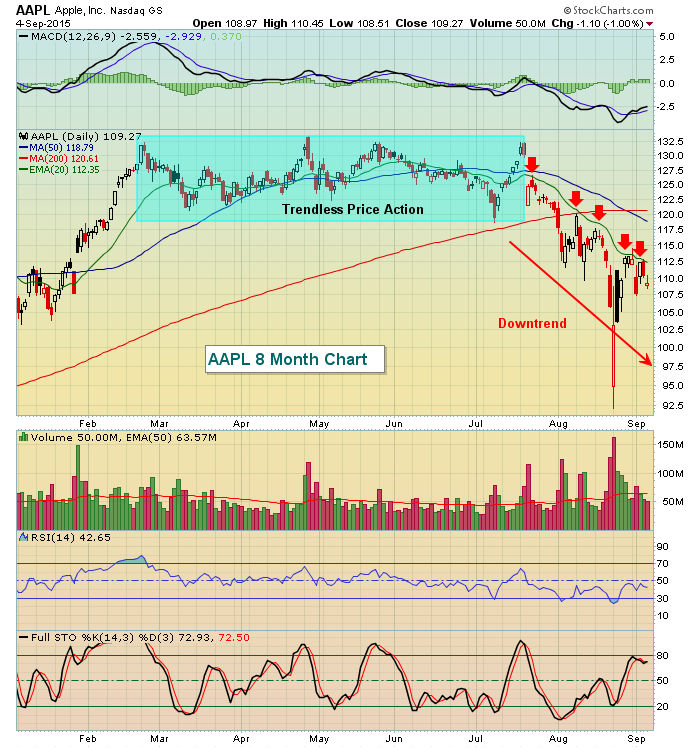
The heavy volume confirmed the July breakdown and the red arrows show the serious resistance faced at the declining 20 day EMA. Don't overlook the power of this key moving average as prices trend.
Happy trading!
Tom
