Much has been said that everything must be fine because the US Banks are holding up just fine. The Banking Index $BKX made new 52 week lows on Monday so that changes the narrative considerably in my mind. From the chart below, we can see it is actually more severe as this level has been the major support for the past two years and we currently sit at levels reached in July of 2013. Both 2014 and 2015 had index lows at this level in Mid-January. A few of the big banks report this week including JPM. The large banks have announced layoffs and many of the banks are below their 200 DMA. This is not a typical news pattern for a new era in the banks now that the Fed has started to raise rates. Something seems to be slipping under the surface. Here is the chart.
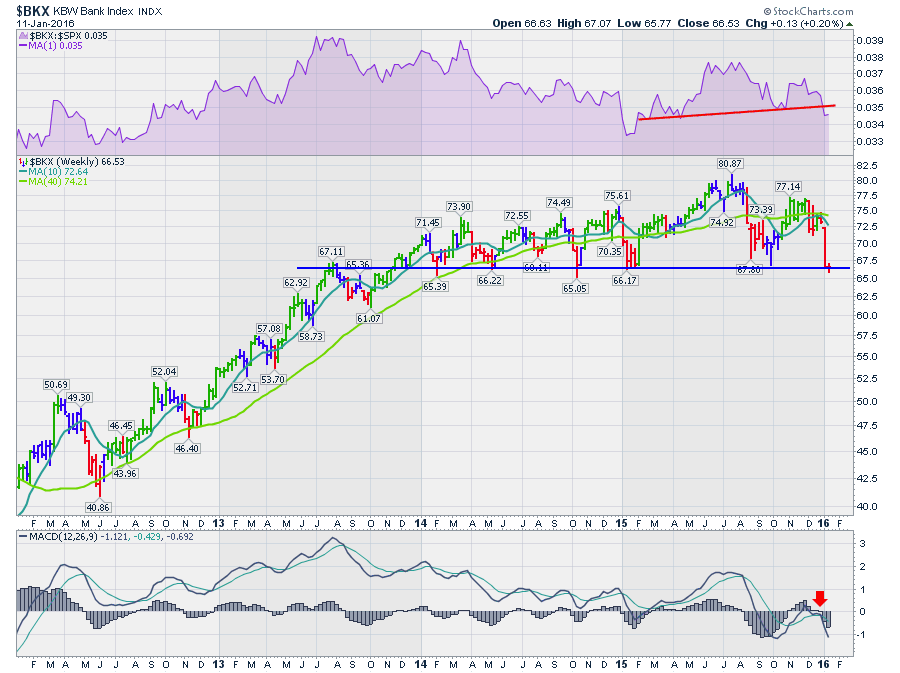
With some of the big banks reporting right away, this chart should hold up here if everything is ok. If it fails to do so, that would be a major pothole in the continuing story of a broken 'bull' market. With major trouble showing across industry groups and sectors, a breakdown in the banking charts would finally alert the financial industry of more wide-spread problems. While the charts have been making us very aware of global problems, Larry Summers article in the Financial Times on Monday eloquently laid out the case for a global slowdown and what needs to be done. Larry Summers - Heed The Fears Of The Financial Markets. I think shocking examples of Anglo-American planning to lay off 85000 of 135000 employees is an example of the severity of the macro picture. However, that barely made the news for a few days.
The MACD rolling over below zero tells me what I am expecting. Tough news. We'll see if the price charts are right in the next few days.
Good trading,
Greg Schnell, CMT