Amazon is becoming a much broader play than online retail and the stock has recently been reacting to the strength of the Amazon Web Services division results. I thought I would write about the drone driver and illustrate some of the points of confusion for technicians. The second part is how to resolve that confusion.
Amazon has two different trendlines on price, that are both valid. How do we discern which one is right?
Both lines are valid. The dotted line has a very aggressive slope. The actual price action in Amazon has pulled back substantially but seems to be holding on this solid blue trendline with a lower slope. We can see at the top that AMZN has started to underperform on the relative strength for the first time in 2 months by breaking the horizontal blue line. This is a little worrisome. The relative strength shown in purple is still well above the long up sloping trend line. As the price is holding above the upsloping trendline as well, it is reasonable to use this lower slope as a support line. If both of these trends (Relative strength and the price trend) were to break, this would probably mark a major trend change for Amazon.
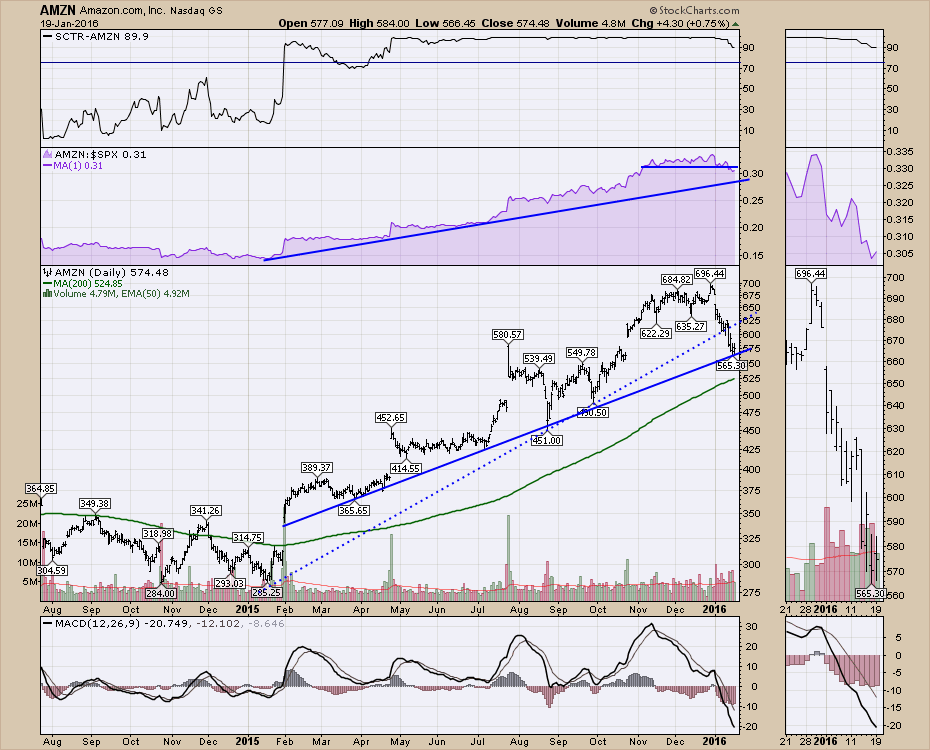
The 200 DMA shown in green looks like a potential target to the downside as well. At this point, Amazon looks like a really strong stock with a nice pullback because of the overall market weakness. If an investor was going to invest in AMZN, they could set their stop just under the trend line or the 200 DMA. If the trend in Amazon is really going to break, a trader wants the stop to be close because we are in a bear market on the indexes. If this level holds, it can be an excellent place to enter with the close proximity to a stop.
A trader should not be afraid to leave if it does not hold up, but the risk/reward is pretty good here. This $575 also has horizontal support/resistance between the Q2 and Q3 earnings. So both the horizontal and up-trending supports are currently valid. The lower slope might have been more reasonable anyway, which is where we have support now. That makes this a real opportunity to buy at a confluence of support with a good location for a tight stop just below.
Good trading,
Greg Schnell, CMT
