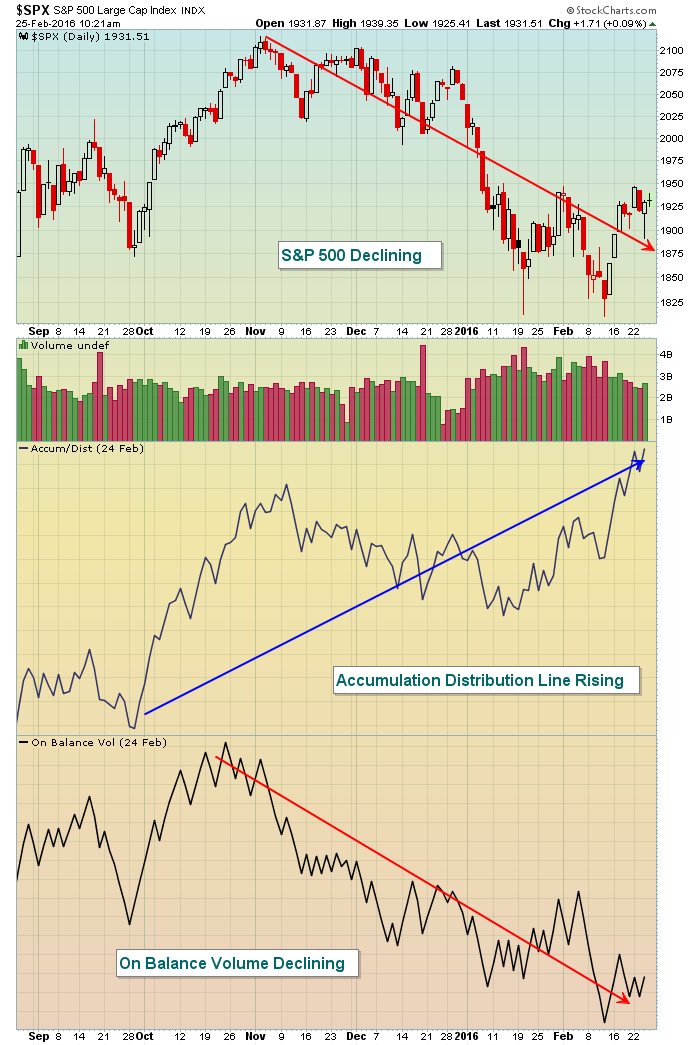
Everyone is trying to evaluate the strength and sustainability of the current U.S. equity rally. StockCharts.com provides us the tools to do just that. But not every indicator tells us the complete truth. A look at the most recent drop in the S&P 500 and subsequent rally exemplifies this point. The accumulation/distribution line (ADL) and on balance volume (OBV) both attempt to provide us an interpretation of the strength of directional movement in our major indices, ETFs, stocks, etc. by using volume-based analysis. The problem is, they use different formulas and can provide very different results, especially in volatile markets. As an example, let's review the S&P 500 over the past several months and compare these two indicators:
 There's a great article in ChartSchool that explains how these two indicators, both attempting to measure market strength/weakness, produce very different results and conclusions. CLICK HERE to review.
These two indicators produce different views in volatile markets where opening prices vary greatly from prior closes. The ADL indicator ignores prior closing prices and instead focuses on where price ends relative to its range for the current period. Therefore, significant gaps lower can still result in the ADL rising if prices rally during the session and finish well off earlier lows. The OBV, however, views this behavior bearishly if the current close is below the prior close, regardless of how much price rallies during the period. That's how these two indicators can move opposite one another.
While my preference would be to use the OBV, the conclusion to be reached here is that neither of these indicators should be relied upon individually. Instead, their signals should be part of a trading strategy where they either confirm or refute other technical indicators.
Happy trading!
Tom
