Weyerhaeuser (WY) has recently surged off the lows. This chart is interesting as the board price for lumber recently surged above a trend line by 10% in 3 days! The chart shows that this was the fastest advance in the last year and looks set to saw through the trend line.
There are a few things on this chart that I like in the indicator set. First of all, the SCTR tested 75 back in November and couldn't hold up. After dropping back down, it has surged back up to the previous level. If it can hold up here, this could be an exciting breakout on the price. Some of the strongest SCTR moves happen when the SCTR goes up to 75, comes back down, and then goes on a real run above 75 for a while. This is a great place to look for that behaviour. Secondly, the RS line is very close to 1-year highs in Relative Strength, shown in purple. If it can break out to new 1-year highs, that will attract a lot of relative strength portfolio managers.
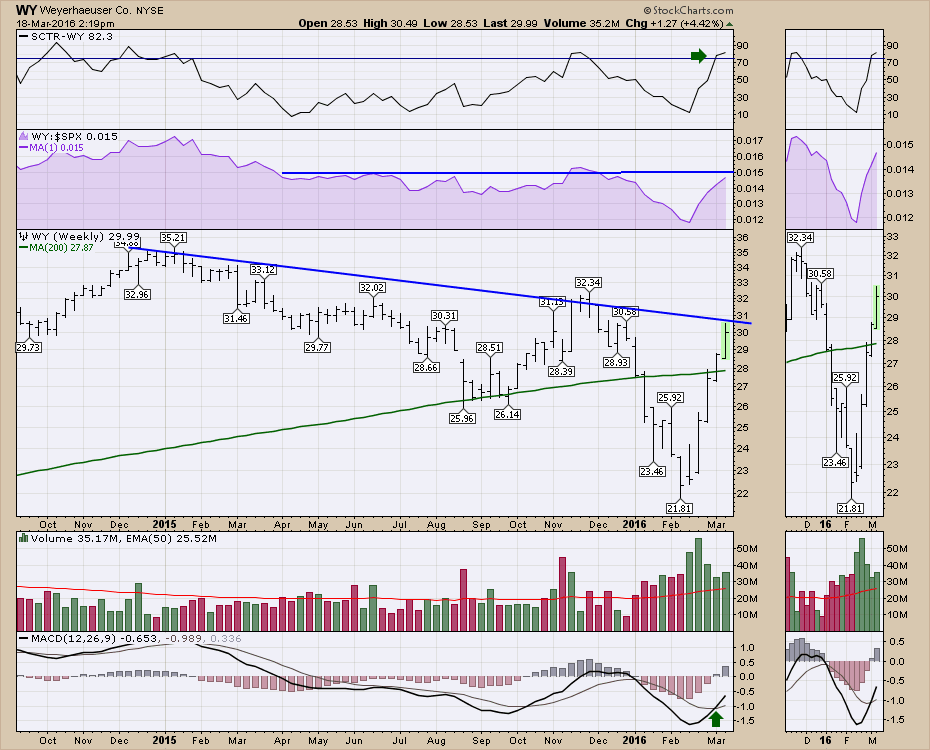
The price is in a significant downtrend, but the volume accumulation on this latest runup is very bullish. Lastly, the weekly MACD has just crossed up showing lots of room to run to the upside.
I couldn't be more focused on the broader market being overextended here, but the $LUMBER chart was highlighted on the Commodities Countdown Webinar 20160317. If you want the specific dialogue, it is at 40:45.The webinar also covered off a lot about the broader market, the outlook for oil, $NATGAS, Coffee and some specific price action around Fed meetings and Options Expiration Day. For a unique perspective on the markets, you might find this interesting. In the meantime, this looks like a good place to start framing your next trade if this breaks above the trendline.
Have a great weekend.
Good trading,
Greg Schnell, CMT, MFTA.