Starbucks has been one of the strongest stocks in the last 5 years. It's been a fantastic uptrend. Recently the stock has started to show some signs of investor deterioration as the price action has started to underperform. The SCTR has been deteriorating lately and today marks a classic fail at price resistance. The RS in purple is threatening to break to 6-month lows.
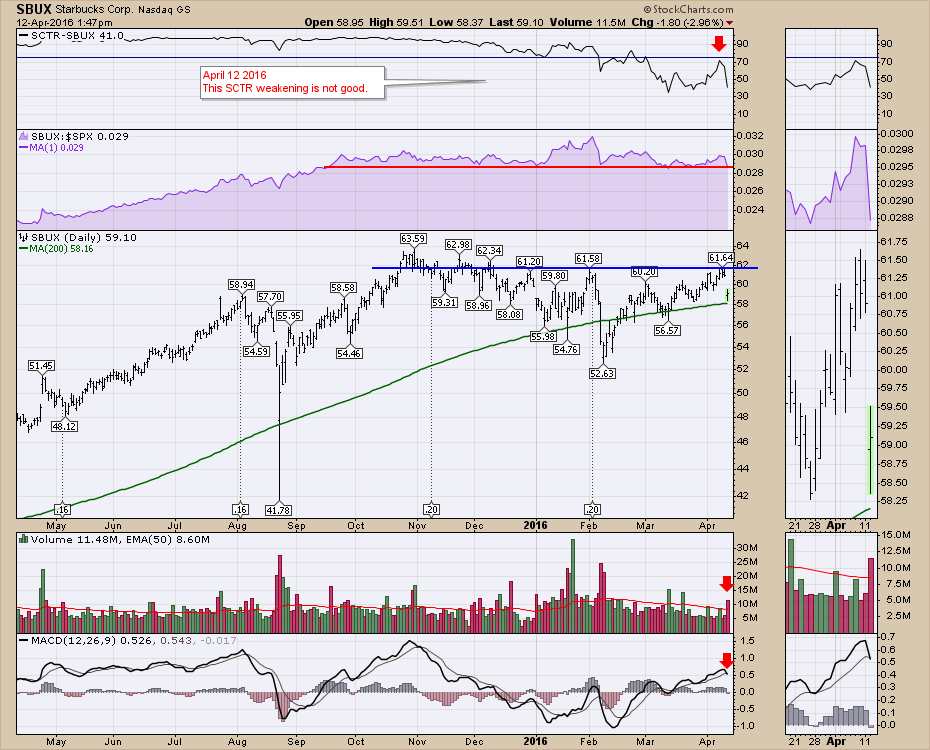
Volume is accelerating on the downtick today and its midday at the time of writing. The MACD has given a momentum sell signal today as well.
Here is an example of the 5-year chart. There are two previous examples of major SCTR weakness. In both cases, the stock was dead money for a while.
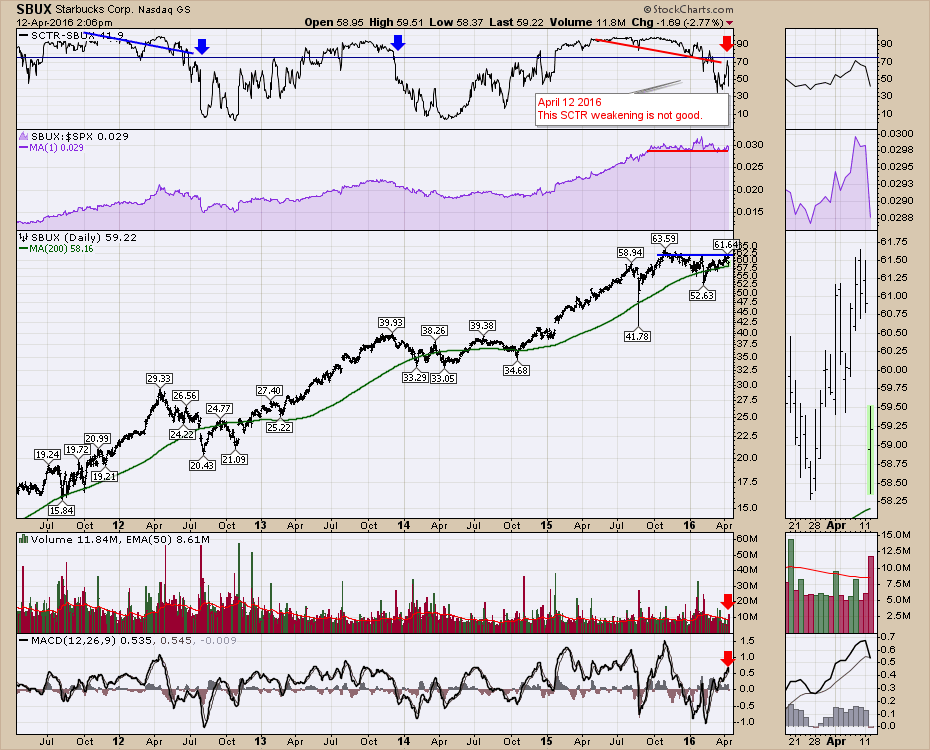 Investors may wish to protect their position in case this weakness accelerates.
I will be hosting a webinar with Martin Pring on April 12, 2016 (today). The overall market trend has stalled over the last few weeks. Martin will have lots of ideas including the US Dollar and the credit market. Click here to register.
Good trading,
Greg Schnell, CMT, MFTA.
