When a stock breaks out to fresh highs with light volume, a negative divergence and overbought oscillators, you need to be on high alert for a period of selling. That's exactly the signal that ORBCOMM (ORBC) provided astute traders as we entered April. Since that time ORBC has pulled back approximately 9% and is approaching key price support and its rising 50 day SMA. I would expect buyers to begin lining up near the 9.50 level. Check out the chart:
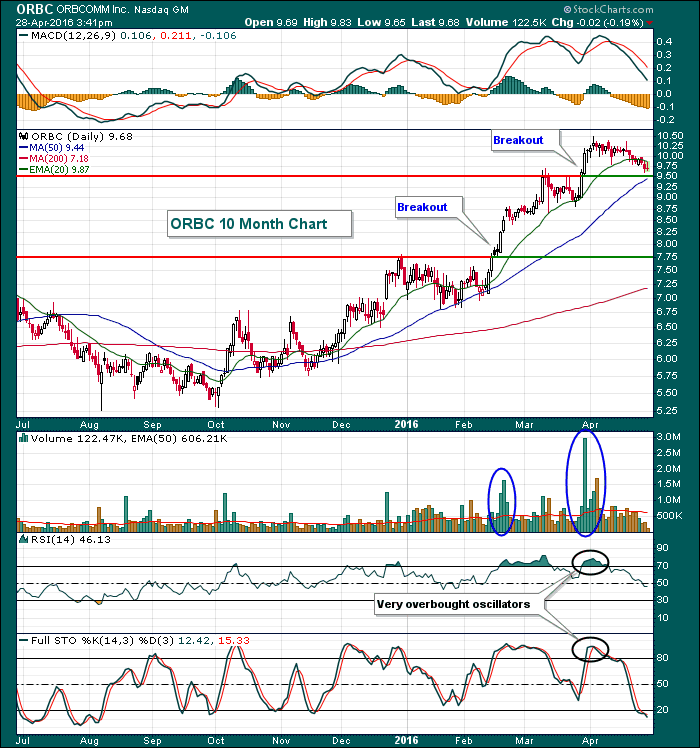
Volume on breakouts has been extremely heavy with pullbacks accompanied by much lighter volume. Note also that while both the RSI and stochastic were stretched at the recent price high in early April, both have now dipped to levels that make sense for entry. You can see during the uptrend how ORBC tends to turn higher once the RSI reaches the 40-50 support zone. While technical analysis never provides us any guarantee, the RSI has dipped back into the 40s, indicative of a much better reward to risk entry.
Happy trading!
Tom
