The surge in stocks entered its fourth week with QQQ extending its channel breakout. The chart below shows the ETF surging earlier this year and then embarking on a correction with a falling channel into June. This correction clearly ended with the breakout near 110 and this zone now becomes the first support level to watch. A strong breakout should hold so a break back below 108 would call for a re-evaluation. With the breakout dominating the chart right now, QQQ is set to challenge its all time high around 115.
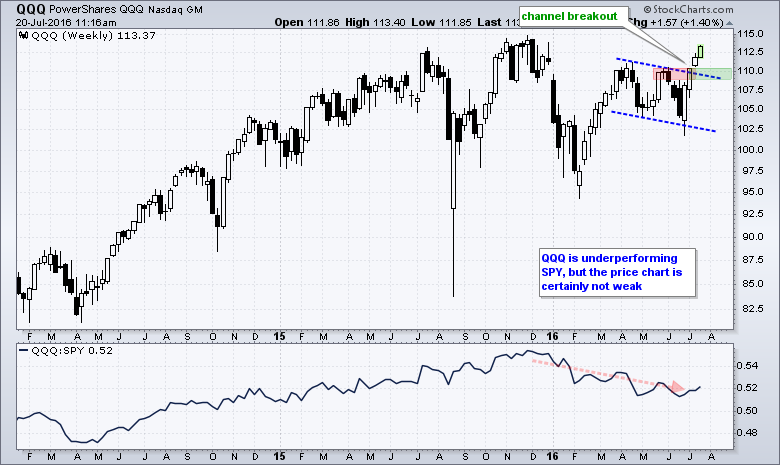
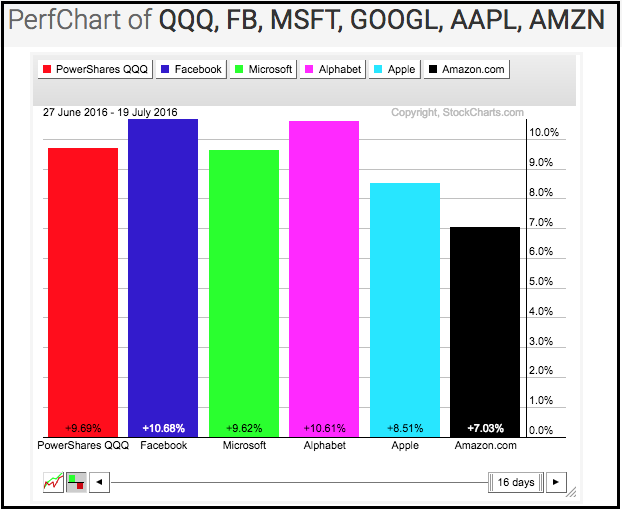
The indicator window shows the price relative (QQQ:SPY ratio) falling the first half of the year and turning up the last few weeks. The overall trend is down, but this should not detract from the breakout, which is unequivocally bullish. QQQ is performing well, just not as well as SPY. And finally, the PerfChart below shows the percentage gain for QQQ and the top five stocks over the last 16 days. Facebook and Alphabet are leading the charge with double-digit gains.
 ****************************************
Thanks for tuning in and have a great day!
--Arthur Hill CMT
Plan your Trade and Trade your Plan
*****************************************
