Freeport McMoran (FCX) is a worthy of a novel related to Technical Analysis of price action alone. Critical parts of the chart outline some interesting times for FCX. First, classic resistance at old highs is a theme. Notice the 2011 peak at the same levels as the 2007 and 2008 peaks. That coincides with the metals commodities topping in 2011.
When oil topped in 2014, Freeport McMoRan topped at the same levels as the 2012 highs, which was while FCX was negotiating the purchase of Plains. That $35-$37 level was friction for three years amidst the commodity slide of basic materials from 2011.
Moving to support, $22.00 to 24.00 was support for 4 years. After falling below support at $24 in 2014, Freeport bounced back up in early 2015, backtested the old support line and the blue line became resistance. After the avalanche going into 2015, FCX bounced at $16 in January and March. For the last year, $14-$16 has been resistance. Now FCX is testing the $14 support level after pushing above to the upper area around $16.
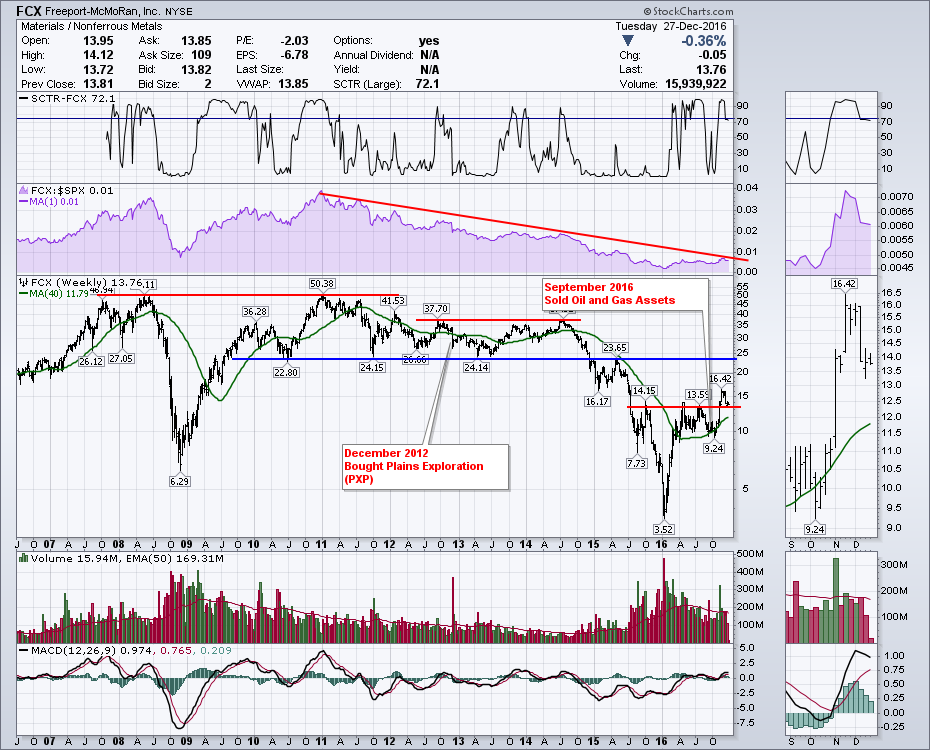
Staying with Chart 1 and looking at some of the other indicators, FCX has not been able to stay above 75 on the SCTR very much in the last 6 years. This year, FCX finally had some relative strength in price movement as shown by the SCTR. Currently, FCX is trying to stay in the top quartile above 75. The Relative Strength shown in purple suggests a five-year downtrend that FCX is testing right now compared to the $SPX. This RS line last touched just before the oil price collapse in 2014. So this is a major place on the RS chart. If FCX gets rejected here, the likelihood of pulling back is very high.
Tehcnically, the price action is set up at a major decision point, much like the opposite back test of the April 2015 blue line on the above chart. Backtests are important technical confirmation points. We have broken out above and we are currently backtesting support from the top side. The next chart is the daily for a close up look.
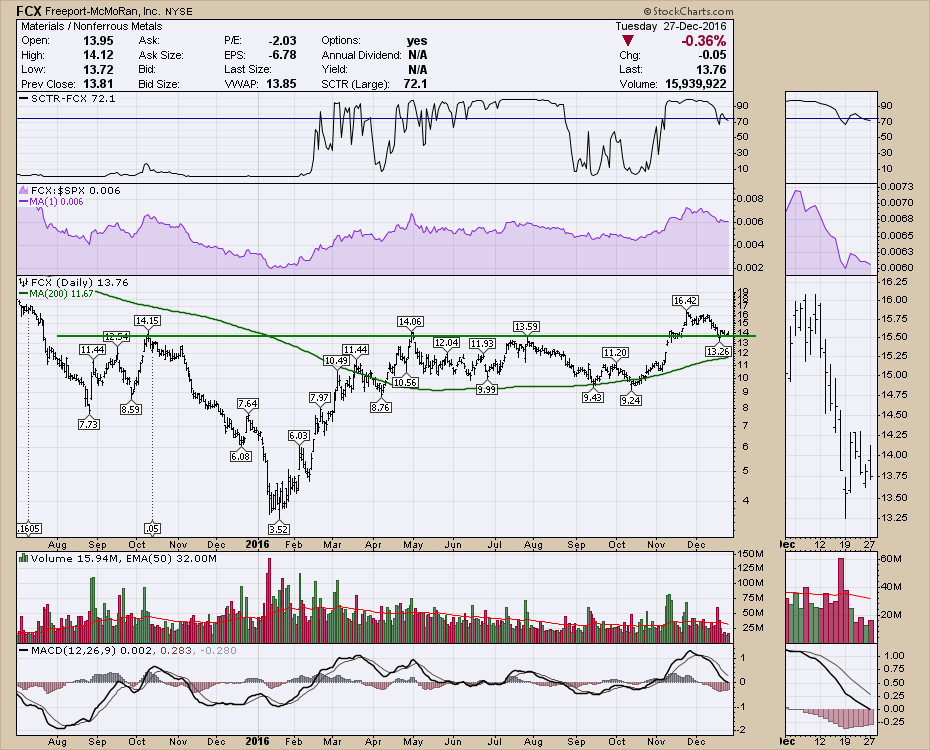 Technically, a bounce here would be a meaningful ride to the upside, suggesting the chart will head up and test $24. A failure here and the price action could sink to fill the gap at $12 or back to the 9-month base at $10. The 200 DMA has also been around $9.50 for the entire sideways move and looks like important support during this whole year. Now it is also at $12 which is near the gap support.
While December is always a little quiet, this chart has run out of buyers or sellers for the last 5 days. The volume is as quiet (see zoombox on right) as it was around the October lows. Even compared to US Thanksgiving this chart currently shows stunningly low volume, day after day. It looks like the calm before the storm. Stay tuned, and Don't Ignore This Chart!
Good trading,
Greg Schnell, CMT, MFTA.
