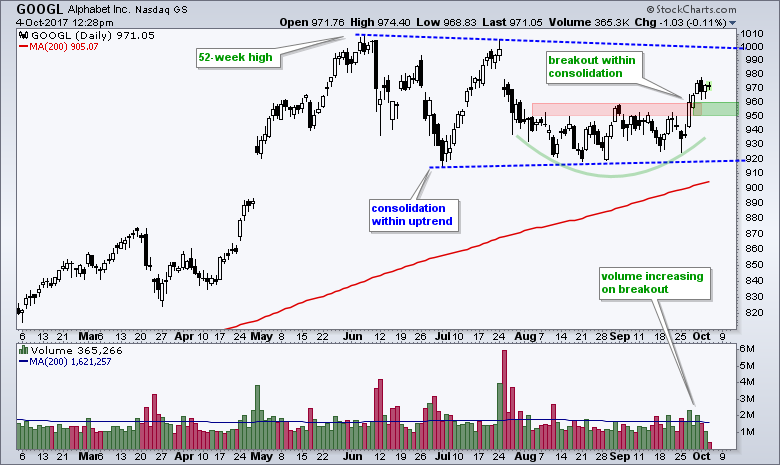
Alphabet, which some of you may know as Google, surged off a support zone with good volume and broke short-term resistance. This breakout could evolve into more because the big picture is also bullish. GOOGL advanced to a new high in May and then consolidated with a long consolidation. The blue trend lines converge slightly so we could call it a symmetrical triangle. Regardless, a consolidation after a 52-week high is typically a bullish continuation pattern and a breakout at 1000 would signal a continuation of the bigger uptrend. Short-term, the breakout in the 950-960 area is holding as broken resistance turns into support. A close back below 950 would negate this breakout and call for a re-evaluation.
Follow me on Twitter @arthurhill - Keep up with my 140 character commentaries.
****************************************
Thanks for tuning in and have a good day!
--Arthur Hill CMT
Plan your Trade and Trade your Plan
*****************************************
