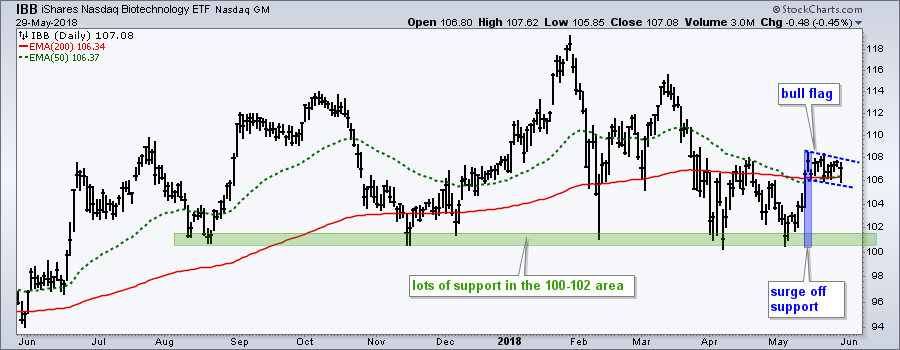
 The Biotech iShares (IBB) surged off support in mid-May and then stalled the last two weeks with a bull flag taking shape.
A bull flag is a short-term bullish continuation pattern. These patterns form after a sharp advance and represent a rest or consolidation. This is often needed to digest the gains and prepare for the next leg higher.
Flags can be flat or slope down and they fly at half-mast. Thus the pole we see in the chart below is only a half pole. A flag breakout would signal a continuation of the prior advance and project a similar move higher. Thus, the length of the pole can be added to the flag low for an upside target.
The chart below shows IBB with a falling flag and a breakout at 108 would target a move to the 114 area. The pole extends from 108 to 100 (8) and the flag low is around 106 (106 + 8 = 114).
On Trend Available to All
On Trend is my show on StockCharts TV. Available to everyone, this show airs every Tuesday at 10:30 AM and is then archived on our Youtube Channel. StockChartsTV and the video archives are available to everyone.
Highlights from On Trend for Tuesday, May 29th
- What do Trendlines Actually Measure
- Measuring Risk On/Off (Dollar, Gold, Yen, Treasuries)
- Euro Breaks Down and Yen Bounces
- Gold Becomes Oversold within an Uptrend
- Italy and Spain Lead Europe Lower (international index symbols)
- QQQ, Top QQQ Stocks, XLF and XLV
Plan Your Trade and Trade Your Plan.
- Arthur Hill, CMT
Senior Technical Analyst, StockCharts.com
Book: Define the Trend and Trade the Trend
Twitter: Follow @ArthurHill


