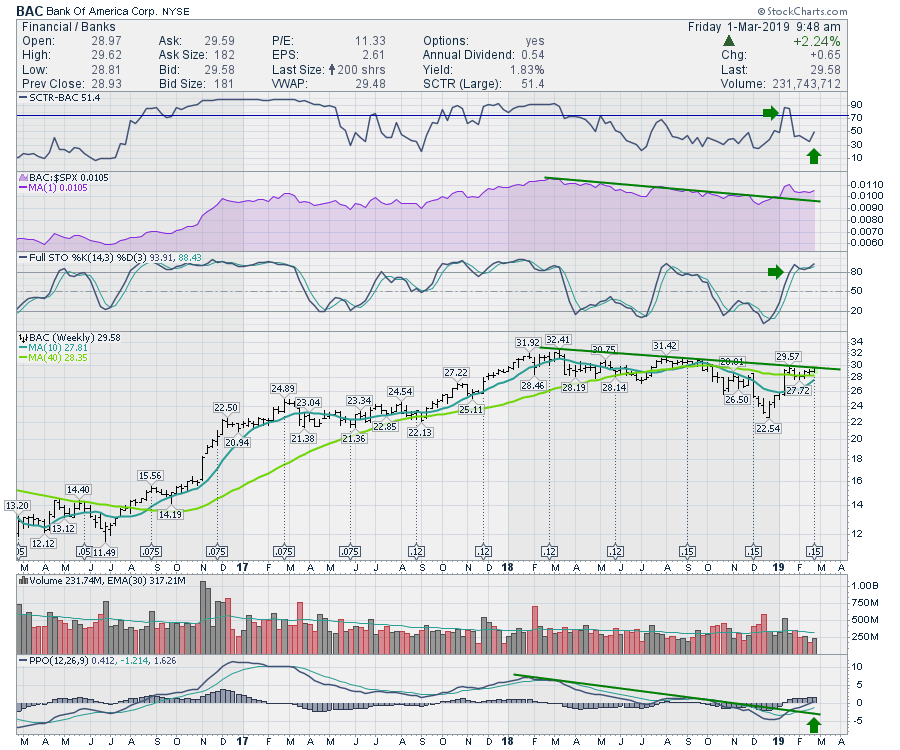
One of the most watched banks is Bank of America (BAC), whose chart has been one of consolidation over the past 12 months. As we start the month of March, investors will see that this bank is poised to break out above the trend line; it would not take much for it to hit new highs. One of the reasons I am interested in BAC is that the SCTR ranking fired off a clue recently that suggests the bank has some buyers pushing up the stock quickly, which is an SCTR signal I have noticed on some charts right before they went on runs. It's almost like a "start your engines" call. BAC surged in early January and has consolidated over the last few weeks. The relative strength, shown in purple, shows the stock breaking a year-long underperformance trend with that surge.
The Full Stochastic on a weekly chart can stay above 80 for months; we have been holding here for the last few weeks.
The PPO (percentage price oscillator) is a momentum indicator that is now at a major point of inflection, much like the price. The most recent low was the first low below zero, going way back to 2016. One of the clues on a weekly PPO is that the final high on the stock before a meaningful price breakdown usually happens after the PPO goes negative for the first time. That doesn't mean that has to happen, but it is usually a good idea to be aware of a major trend change possibility.
If the PPO was going to roll over just around the zero area, this would be exactly what we need to watch for. As price tries to break out, momentum fails and the stock rolls over quickly, trapping investors. The other result is that the PPO finally goes positive. Looking to the left on the chart, we can see that a condition where we have a positive and rising PPO is very bullish. A stock that has a PPO accelerating higher is usually on a strong run.
When the following conditions are prevalent in a stock, they mark one of the places to invest with the highest risk/reward breakouts:
- The stock has exhibited some price strength recently.
- The stock starts to outperform relative to some benchmark - in this case, the stock is compared to the $SPX, shown in purple.
- A trend line is being tested. If price stays above, keep holding the stock.
- The momentum is breaking a downward trend and is now moving up above zero.
All of the conditions seem right for BAC to start a run. We just need the signal to change from "Wait" to "Go!" That would happen on a break above the trend line.
Good trading,
Greg Schnell, CMT, MFTA
