TAKEAWAYS
- Target Corp (TGT) bucked the trend on Tuesday, popping 13% despite a broader market selloff.
- Investors jumped in despite the retailer's weak 2024 guidance.
- A potentially strong entry point for TGT rests on two factors, one technical and the other fundamental.
On Tuesday, Target Corp (TGT) was one of only nine stocks that bucked the market selloff, popping 13% on a Runaway Gap as the Dow Jones cratered -404 points, the S&P 500 fell over 1% and the Nasdaq plunged 1.56%.
On the following day, Target gapped up again. So what's driving the bullishness?
Target's holiday-quarter revenue and earnings crushed Wall Street expectations on Tuesday. Despite the company issuing a gloomier sales forecast for 2024, bullish investors jumped in, causing price to spike (and gap) twice. Before taking a closer technical look into TGT, though, some traders might ask:
- Was it prudent to follow the bullish trend post-earnings? After all, some analysts think that Wall Street consensus set a low bar for expectations. What if this is the case?
- If you are bullish on TGT, while keeping in mind the company's soft forecast for 2024, when might be an opportune time to enter a long position, assuming that share prices will eventually decline?
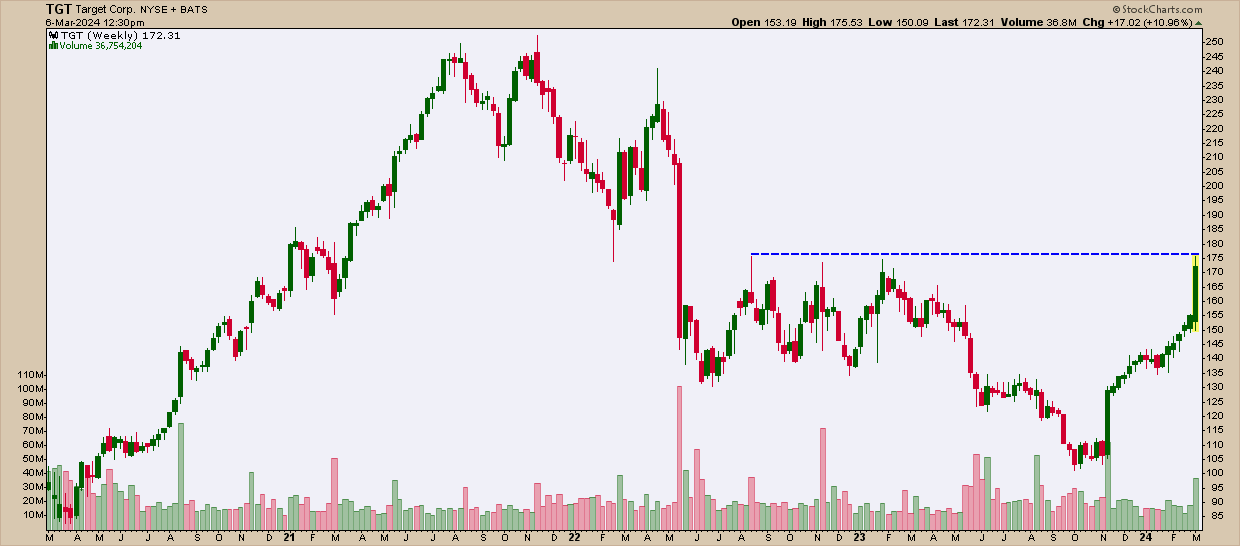
Target shares are far from their 2021 all-time highs. Though the stock hit a 52-week high today, that high coincided with strong critical resistance (see dotted blue line) and immediately fell back.
If TGT's current uptrend were to continue, it would have to break above this level. That can certainly happen, but what are the chances of it happening anytime soon?
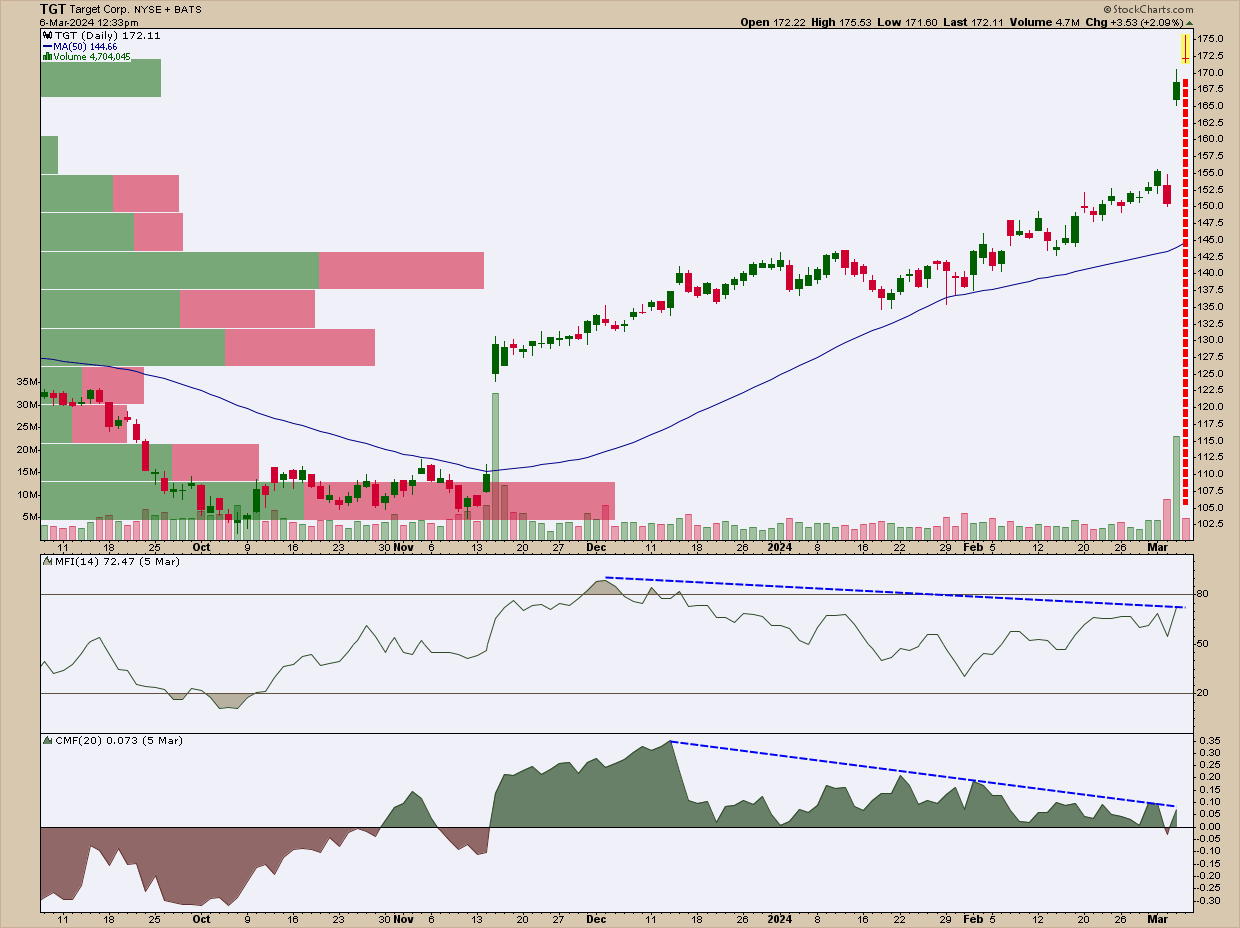
The second candlestick from the last session shows the 13% spike (and gap) that took place post-earnings. Runaway gaps, according to technical analyst Thomas Bulkowski, are quite bullish with only an 8% chance of getting filled within the week of the gap.
But the second gap, showing strong rejection from the resistance level we saw in the previous chart, is looking more and more like a possible exhaustion gap, which has a 60% chance of getting filled within the week. Plus, take a look at the lack of volume driving the gap (see red vertical dotted line).
Looking at the Money Flow Index (MFI), which is something of a volume-weighted RSI, we see a steady divergence between it and TGT's three-month surge, indicating that buying pressure is indeed dwindling. This thesis is even more pronounced when viewing the Chaikin Money Flow (CMF) alongside the MFI.
Watch for These Two Things
Drawing a Fibonacci retracement would be a bit premature, as the top hasn't yet been confirmed. However, supposing that it was, the 50% Fib retracement line would coincide with the Volume-by-Price indicator's second largest bar, around the $140 range.
Technically, if TGT were to top here, that range might serve as a favorable entry point. If that were to be the case, you might set a price alert at $150 to call your attention to the potential setup if and when it happens. But on the fundamental front, you might want to wait for clear signs that TGT has overcome its recent dip in customer traffic as it heads into fiscal 2024. Traffic is key to TGT's earnings, particularly considering its forecasts for weaker quarters ahead.
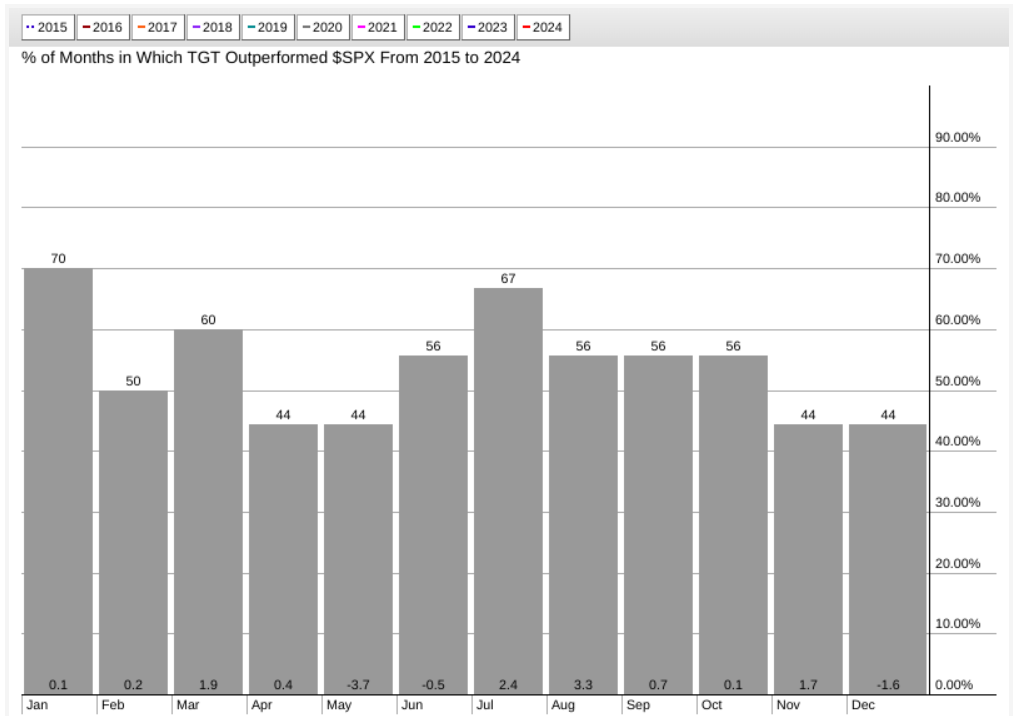
And just to throw in a little more context, July and August are the retailer's strongest months relative to the broader market (at least from a 10-year seasonality perspective), as shown below:
How To Set a Price Alert
Setting a technical alert at these support and resistance levels would be helpful as you weigh your potential entry points against any market developments that may influence your decision.
To access the Technical Alert Workbench, follow these steps:
- Log in to your StockCharts account.
- Click on Your Dashboard.
- Click the Alerts button or the New button in the Your Alerts panel.
- In the Alerts workbench, choose which type of alert you want to create from the Alert Type buttons at the top left.
- To create a price alert, select Price Alert as the alert type.
- Add a symbol in the symbol box, set your price trigger, and choose how you wish to be notified.
- Click the Save Alert button.
Disclaimer: This blog is for educational purposes only and should not be construed as financial advice. The ideas and strategies should never be used without first assessing your own personal and financial situation, or without consulting a financial professional.
The author does not have a position in mentioned securities at the time of publication. Any opinions expressed herein are solely those of the author and do not in any way represent the views or opinions of any other person or entity.
