In this short trading week, the equities ended the week on a negative note. In a week that saw the Markets moving in the 250-points range, the NIFTY ended the week near its lowest point. The benchmark Index lost 155.45 points (-1.46%) on weekly basis.
It was for the seventh consecutive week that the NIFTY has met resistance and has not moved past the 50-week moving average.
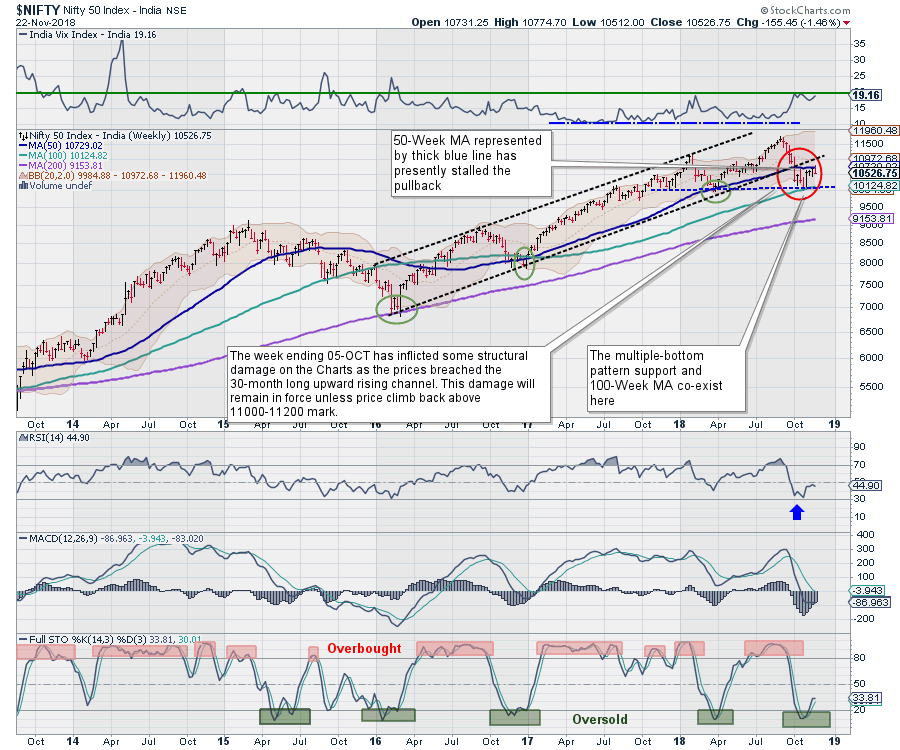 The coming week also has the expiry of the current derivative series to deal with; given the present structure of the charts, we do not expect any meaningful upsides to occur. Up moves, if any, will find stiff resistance at the 50-Week Moving average, which is presently at 10729. Sustainable pullbacks will occur only after the index moves past this level.
NIFTY is likely to face resistance at 10700 and 10790 levels while supports will come in at 10410 and 10330.
The Weekly RSI is presently at 44.8998; it is still neutral and does not show any divergence against the price. It can be seen inching lower after marking a lower high. Weekly MACD remains bearish as it trades below its signal line. PPO too stays negative.
An engulfing bearish candle has emerged near the 50-week moving average. If we look at its significance in the context of the present structure of the charts, the formation's appearance near this resistance area has reinforced the credibility of the 50-Week MA as the overhead resistance for NIFTY going ahead.
Upon performing pattern analysis on the Charts, it is evident that, after breaching the 30-month long upward rising channel, the NIFTY has taken support at its 100-week moving average and a triple bottom pattern support. It saw a sharp technical pullback from this zone; currently, this pullback is getting stalled at the 50-Week MA which is presently at 10729.
NIFTY currently remains in a broad range of 10100 on the lower side and 10750 on the upper side. The index presently trades towards its upper range. The coming week is less likely to witness any significant up-move and we might see some weakness persisting in the markets. We continue to suggest keeping exposures modest and protecting profits at every rise that the markets offer. With the markets having a difficult trajectory to negotiate in the next few days, we recommend approaching the coming week with high degree of caution.
Sector Analysis for the coming week
In our look at Relative Rotation Graphs, we compared various sectors against CNX500, which represents over 95% the free float market cap of all the stocks listed.
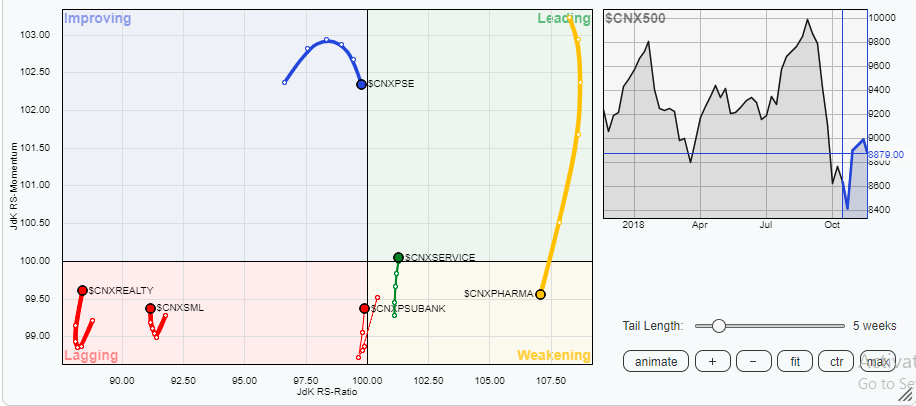
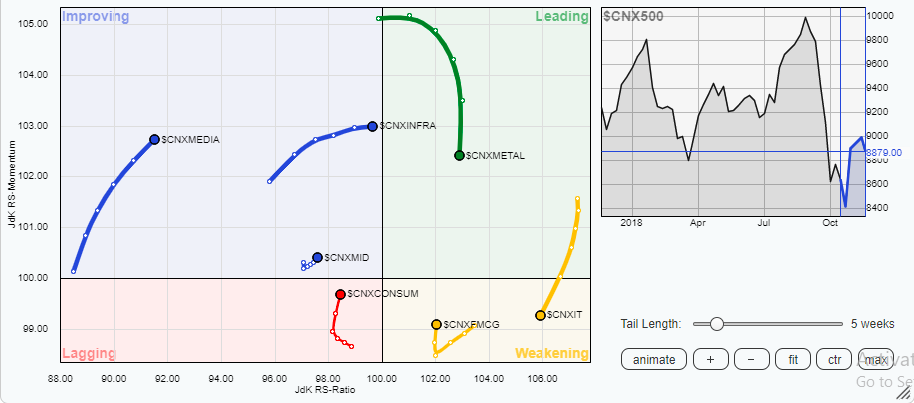
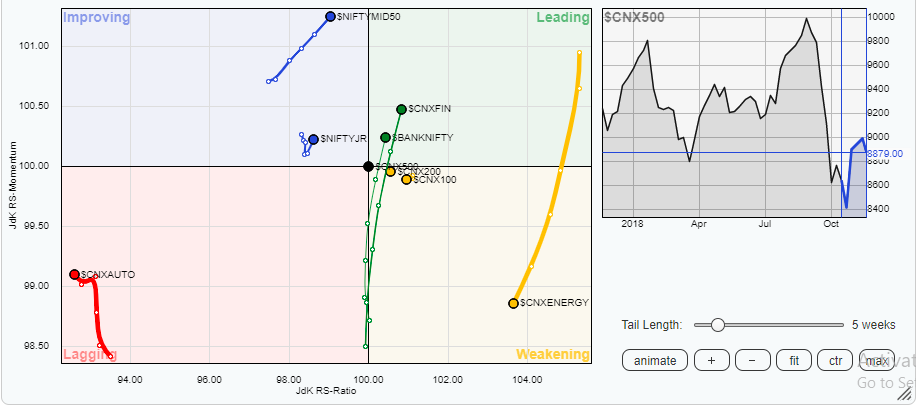 Detailed inspection of the Relative Rotation Graphs (RRG) presents a mixed picture. Pharma Index and IT Index have moved into weakening quadrant. This has happened after a sustained loss of momentum over past couple of weeks as these indexes are seen taking a breather. The Metal Index, too, has shown relative loss of momentum, but it continues to remain in the leading quadrant. On the other hand, the Financial Services Index, along with Bank Nifty, has moved in the leading quadrant after a parabolic improvement in relative momentum over past couple of weeks. The Infrastructure and Media Index have continued to show continued improvement in their momentum relative to general markets. The coming week will see relative out-performance from Bank Nifty, Financial Services and Midcap stocks while Infrastructure and Media stocks are expected to offer resilient performance relative to the general markets. Some improvement on the relative momentum front is also observed in the FMCG, Consumption, Realty and PSU Bank stocks, along with NIFTY Next 50 (NIFTY Junior) pack. These indexes are likely to witness stock specific out-performances against the general markets. No major show is expected from the Auto, Small Caps and Energy stocks.
Important Note: RRG™ charts show you the relative strength and momentum for a group of stocks. In the above Chart, they show relative performance as against NIFTY500 Index (Broader Markets) and should not be used directly as buy or sell signals.
Milan Vaishnav, CMT, MSTA
Consulting Technical Analyst
www.EquityResearch.asia
