
A powerful profit-enhancing tool has just been refined and put on steroids. Back in December of 2013, I wrote a blog titled “Possibly the Single Best Visual Analysis Chart Ever.” Bill, my good friend at Stockcharts.com, is an exceptional developer, and he figured out a way to make this tool easier for us investors to use while at the same time bolstering its clarity and visual value.
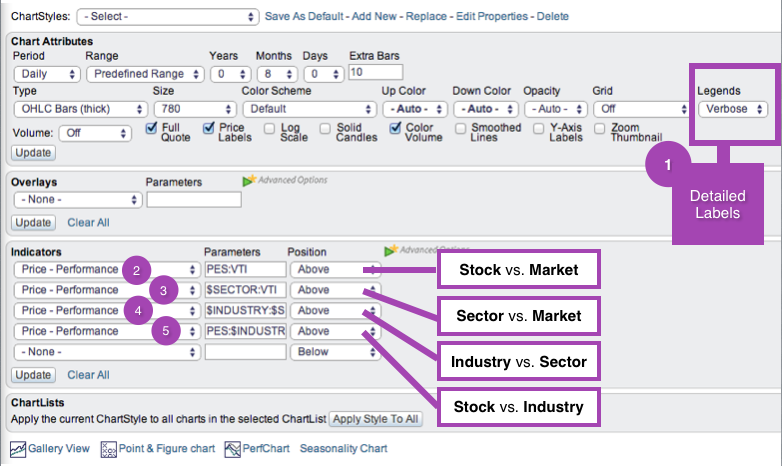
In lieu of rewriting the previous blog, I’d just encourage you to reread it. The beauty of the new syntax is that saving this chart in template form to be used again and again becomes a breeze. We no longer have to look up symbols for sectors or industries because the program does this for us. Simply type in “$SECTOR” or “$INDUSTRY”, and voila! If you pull down the “Legends” menu and click on “Verbose”, the charts give the full label descriptions, too. Very cool.
The chart below illustrates a top-down analysis strategy, beginning with the market and working down through the sector, industry, and to the individual equity. The objective is to align trends by putting the winds of probability at your back. Your likelihood of achieving a profitable trade increases significantly when the equity’s sector is outperforming the market, its industry group is outperforming its sector, and the stock itself is outperforming both its industry group and the market overall.
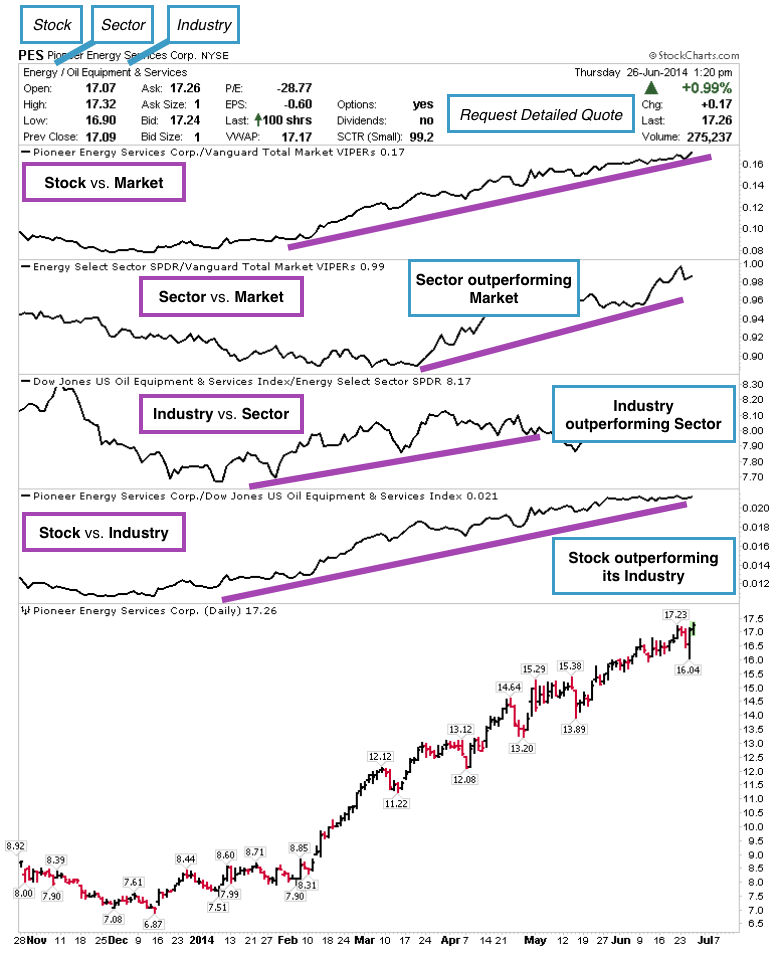
You’ll notice that Pioneer Energy (PES / price $8.00) begins to outperform its industry group peers beginning in late 2013. In February, 2014, its industry group starts outperforming the Energy Sector. By March, PES is now at $12.50. At this point, the Energy Sector is outperforming the market, the Oil & Gas Equipment Services Industry is outperforming its Sector and PES outperforming them all. Within the next three months, PES moves from $12.50 to $17.25 for a 38% gain.
Trade well; trade with discipline!
-- Gatis Roze
The Probability Buster Chart: Possibly the Single Best Visual Analysis Chart Ever- Dec. 13, 2013

If there was one mantra to embrace which would make you money it would be“let the probabilities work for you” or some similar phrase. As a seasoned investor with over 25 years trading the markets, I feel one of my core strengths has been my ability to find ‘probability enhancers’ that each contribute in their own unique way to put a little more probability wind at my back. Some traders call it intuition, but after all these years, I can honestly claim to have a ‘buddy breeze’ behind me as I invest.
We have all heard the maxim “the trend is your friend”. On the other hand, 4 trends become your best friends and should become part of the family. This is indeed the basis for my probability buster chart. Understanding the inter-relationships between markets, sectors, industries and individual equities is crucial. Most investors understand that “a rising tide lifts all boats.” The smart money takes it deeper and knows that the height of the rising tides varies significantly amongst different sectors and industries. The smart money also knows that big bucks are made by aligning the strongest sectors and industry groups, thereby trading in harmony with the most powerful rising tides within the market. Think of it as relative strength analysis on steroids that highlights stocks for which the big institutions have a growing affection. This ‘growing affection’ results in accumulation which, put in equivalent terms, significantly raises the probability of an uptrend for the equity in play.
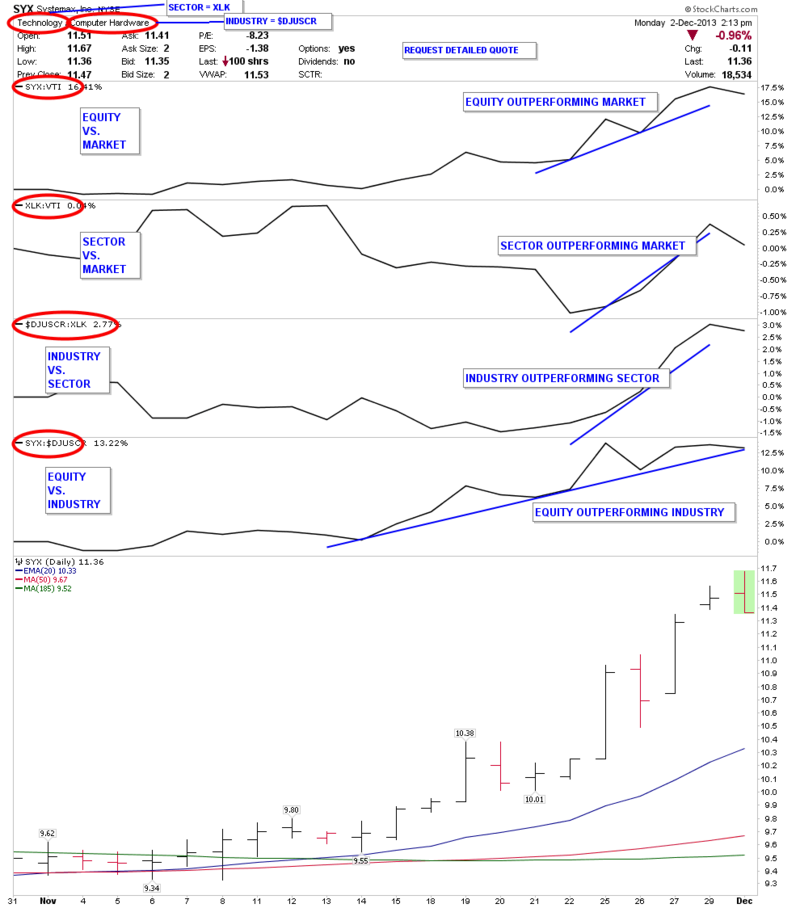
Not too long ago, the institutions had peerless expensive investment tools and all the advantages, resulting in a playing field that was far from level. Today, on the other hand, individual investors have inexpensive yet powerful relative-performance charts such as the one below. These are the simple steps necessary to reproduce this ‘Probability Buster Chart’. I’ll use Systemax Inc. (SYX) as an example.
Under ‘Chart Attributes’, check ‘Full Quote’.
This shows you that SYX is in the Technology Sector, and within that sector, it’s part of the Computer Hardware Industry.
Under ‘Indicators’, you pull-down ‘Price Performance’ and enter 4 parameters for each of the price relative charts. The parameters are these:
a. SYX : VTi – I use VTi for the total market. It’s Vanguard’s ETF and a good proxy.
b. XLK : VTi -- The Tech Sector relative to the total market.
c. $DJUSCR : XLK – The Computer Hardware Industry relative to its Sector.
d. SYX : $DJUSCR – The equity relative to its Industry group
The objective is to align all 4 up-trending price relative charts. When the tide is rising on all four fronts, the relative strength probabilities are working for you with all four trends.
To speed up the production of this format, I save a ‘ChartStyle’ that I call ‘Price Relative’. This can be achieved by using ‘X’ as a placeholder for the Sector and Industry group symbols. For example, in the above situation.
a. SYX : VTi There’s no need for a placeholder here because SYX gets automatically replaced when you input your equity symbol of choice up top.
b. XLX : VTi – The second ‘X’ in ‘XLX’ is just a placeholder to remind you to input one of the 9 Sector symbols.
c. $DJUSXX : XLX – The last two ‘Xs’ in the industry group symbol are placeholders for the Industry symbol, just as the second “X” in the Sector symbol.
d. SYX : $DJUSXX – The last two ‘Xs’ in the Industry group must be input with the appropriate Industry Group symbol to produce a meaningful chart.
Once you get familiar with the layout, the visual analysis benefits will be immediate. May the oracle of probabilities be with you!
Trade well; trade with discipline!
-- Gatis Roze


