 This is the fifth biweekly Action Practice blog we’ve done together, so I’ll assume most readers are up to speed by now and I don’t need to repeat specifics about “Permission To Buy”. Here is the link to the Action Practice #4 blog which we will address below.
http://stockcharts.com/articles/journal/2016/10/charts-im-stalking-action-practice-4.html
1. Per our methodology, our foremost concern is to answer this question: Is the market trending up, sideways or down? The specific charts we deploy are all laid out in the Tensile Trading Chartpack within the three Permission to Buy ChartLists (10.1, 10.2 and 10.3).
2. The Action Practice PerfChart presented for analysis on October 14, 2016 plotted ten different biotech ETFs. Per my suggestion, I wanted you to understand the character of each ETF and not just pick the best looking chart. I refer to this approach of combining technicals and fundamentals as “Rational Analysis”. Whether you used the sites I recommended — such as ETF.com, ETFdb.com, or XTF.com — or whether you used your own broker’s website, your objective was to both understand the candidates and to whittle down the field based on your own unique criteria. Here is my particular criteria.
- I do not use leverage or inverse ETFs. This therefore eliminates BIB, LABU, LABD and BIS.
- Assets under management trading volume, and net expense ratios matter to me. For this reason, out went BBP.
- Three-year and five-year performance matters greatly. Therefore, out went PBE.
- Those ETFs left standing were XBI, IBB, BBH, and FBT.
3. One of my brokers is Charles Schwab. They have a sensational comparison tool that allowed me to place the four candidates into a seven page side-by-side comparison matrix, along with a list of criteria. As I said earlier, your criteria is unique to you as an investor. It will no doubt be different than mine.
Side-by-side, I considered the following criteria:
- Expense ratios.
- Trading spreads & volumes.
- Three and five year returns.
- Portfolio turnover.
- The median market cap of their individual holdings. I wanted them skewed more towards giant and large biotech corporations. My assumption being that biotech is too volatile for my taste in the medium, small and micro corporation space for me to trade. Also, I assumed that no one knows potential biotech success stories of the future better than the large biotech corporations themselves. When the big guys see potential winners, they will buy those smaller corporations and I will be onboard.
4. Thorough analysis of the top 10 individual stock holdings of each Biotech ETF. Based on this criteria, my winner is BBH.
5. Do I now rush out and buy BBH? Not yet. I track the ETF’s largest holdings and when those begin to show relative strength, I’ll jump aboard. In other words, I have no idea when the train will leave the station, but I’ll be ready when it begins to roll. For now, I’m stalking the following: Amgen (AMGN); Gilead Sciences (GILD); Allergan (AGN); Celgene (CELG); Biogen (BIIB); and Alexion (ALXN)
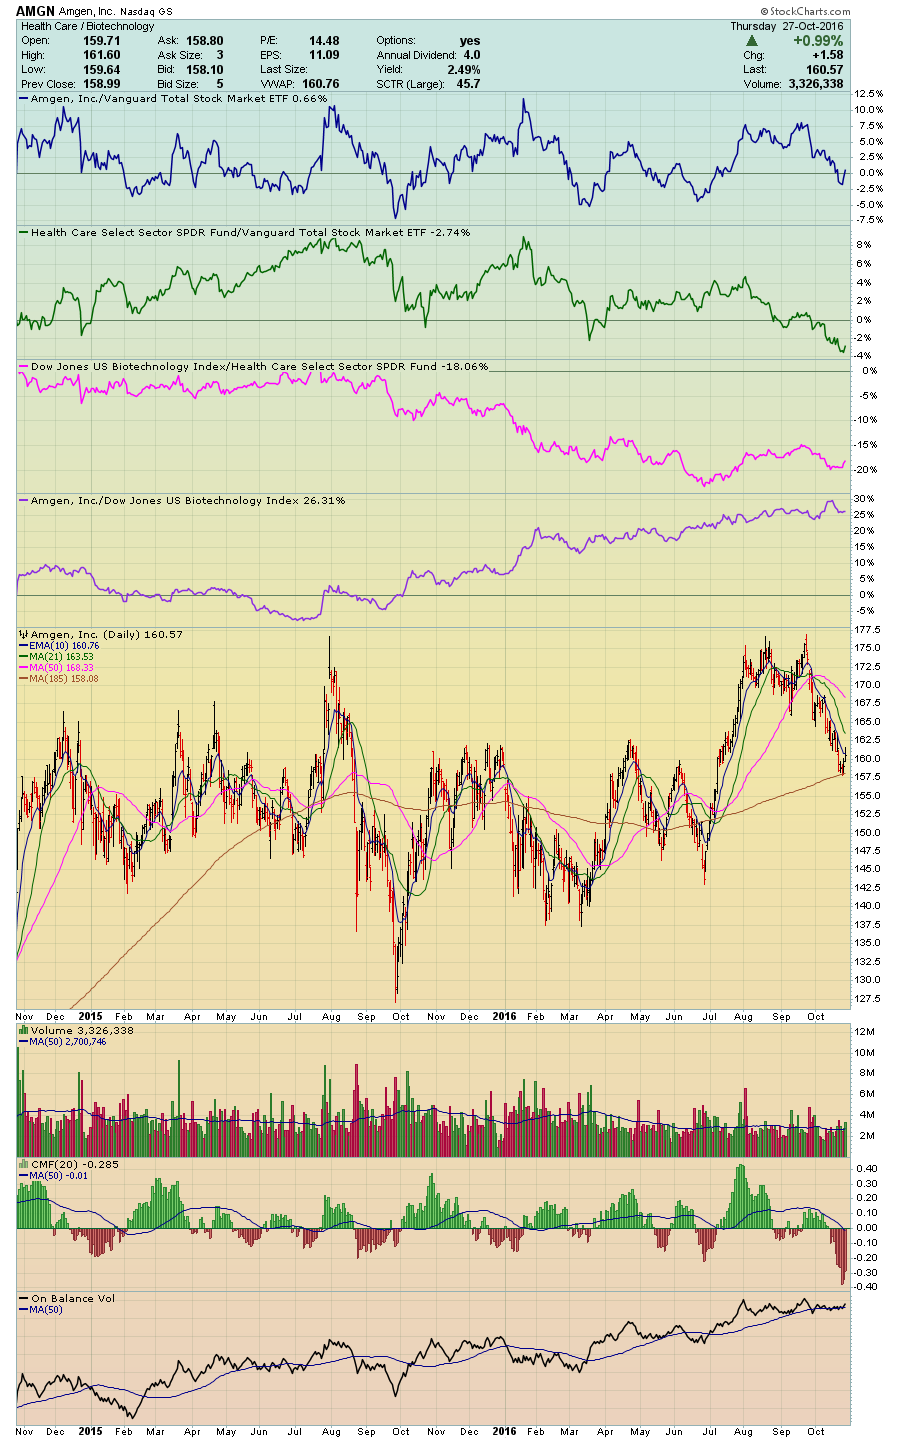
THIS WEEK’S ACTION PRACTICE EXERCISE.
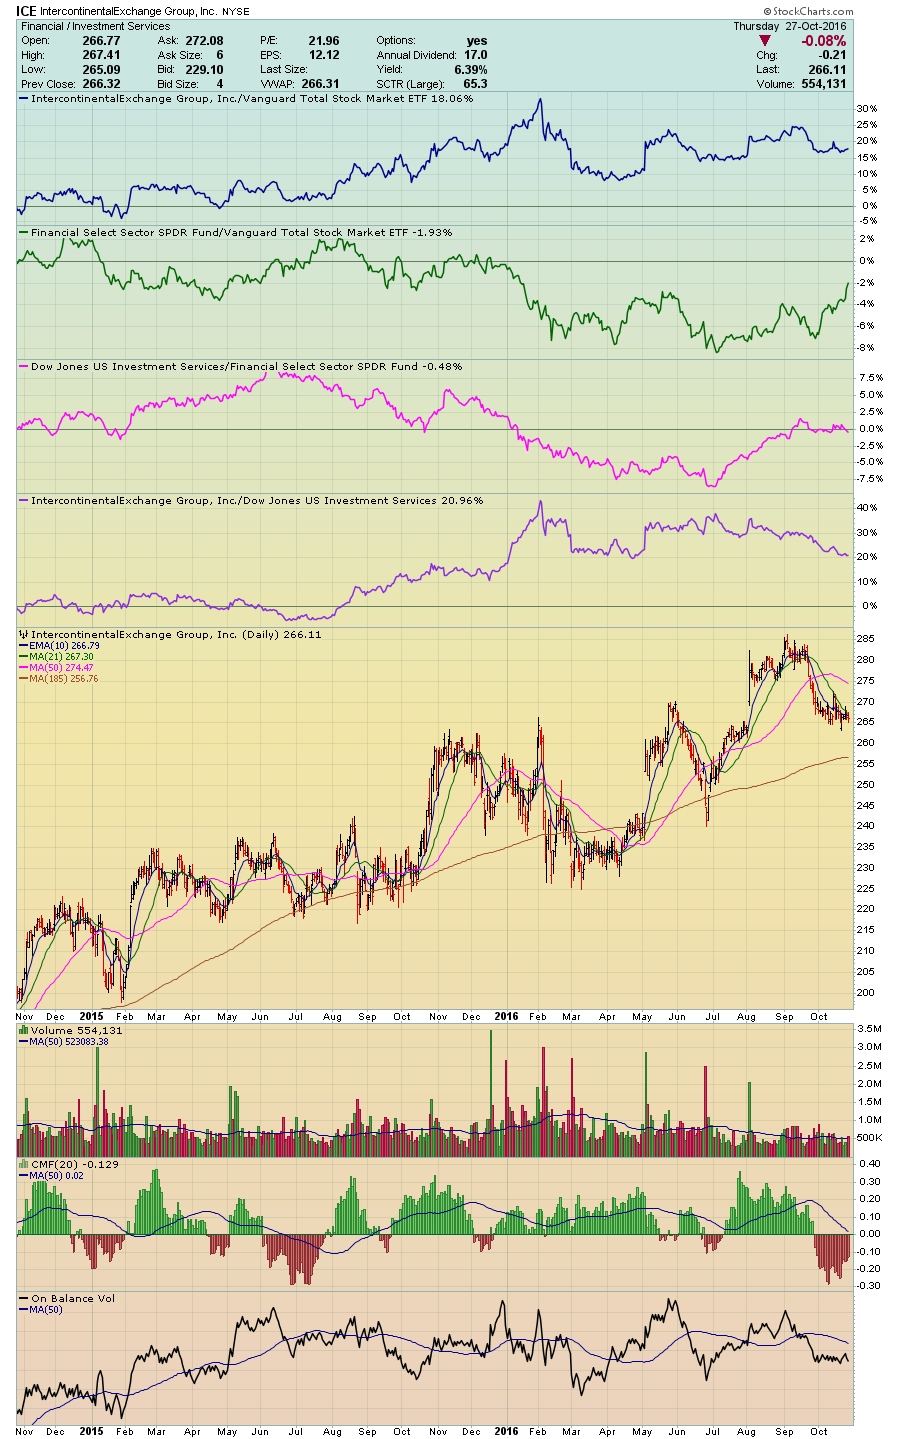
We are stalking the following:
Intercontinental Exchange (ICE)
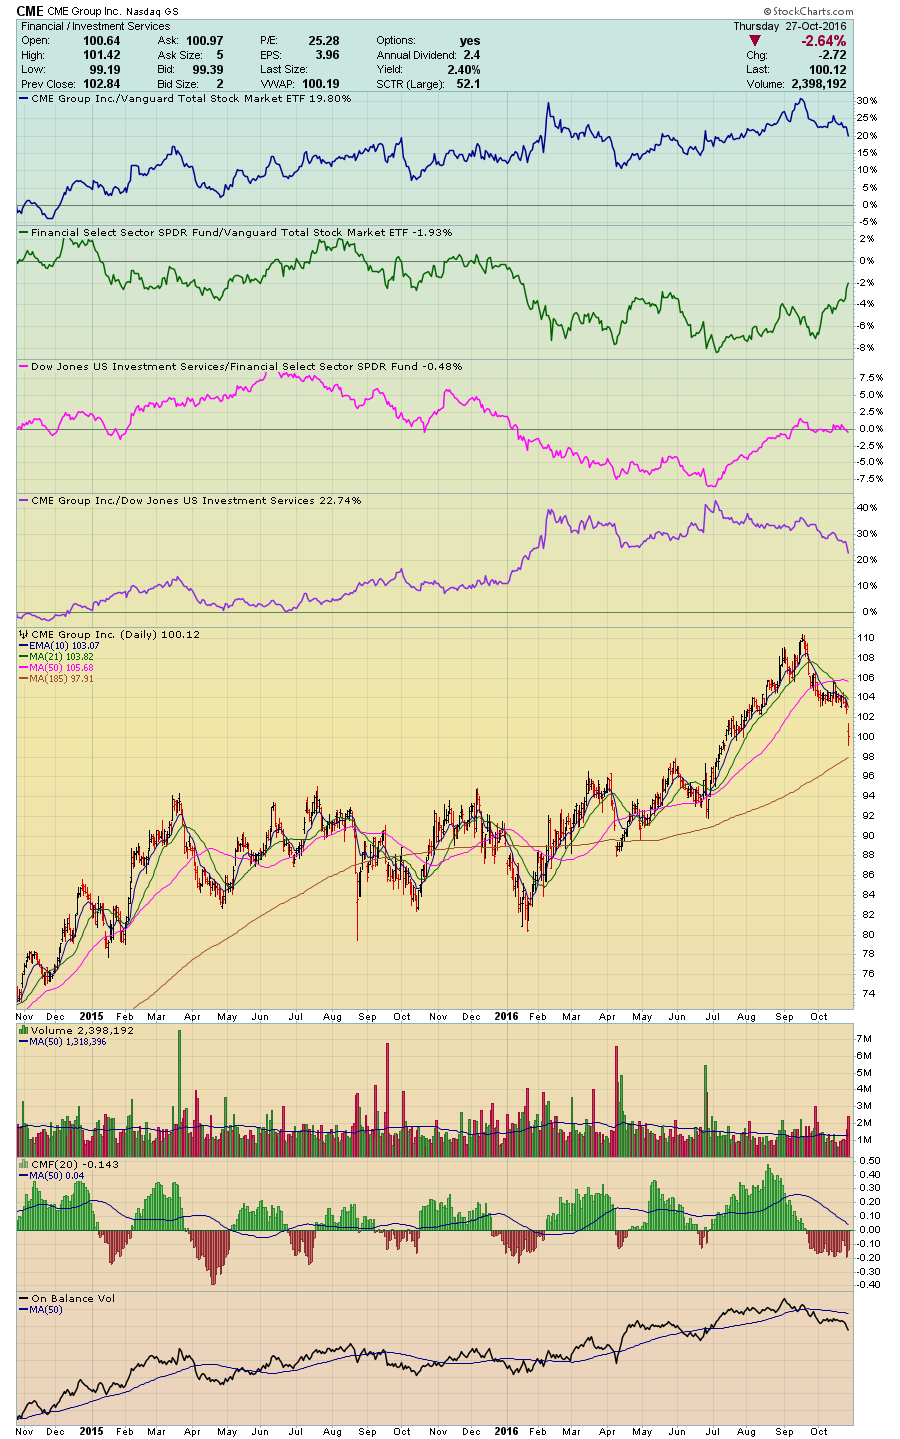
CME Group (CME)
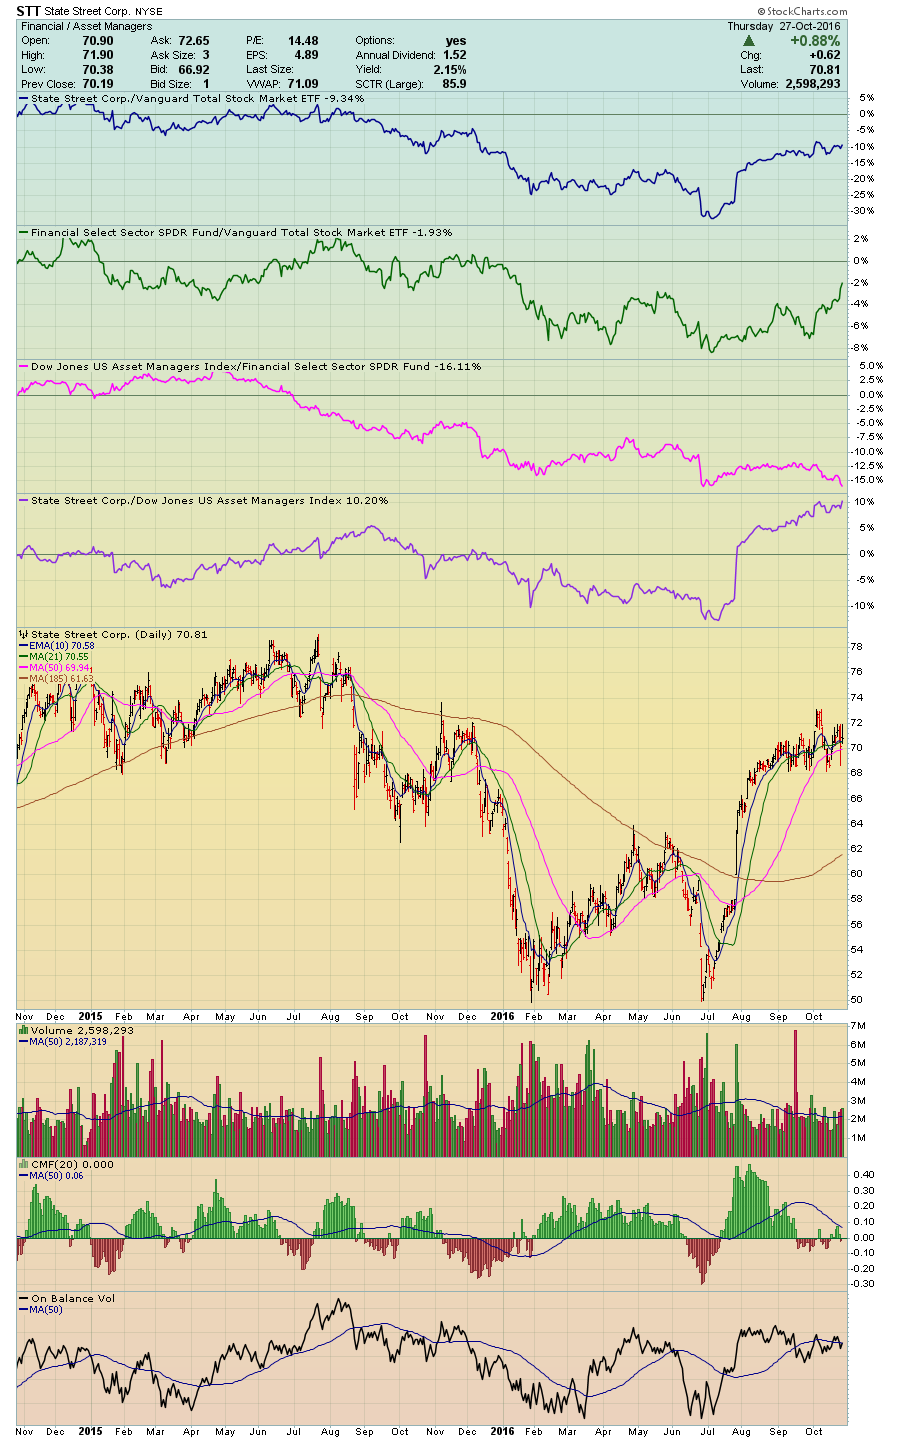
State Street Corporation (STT)
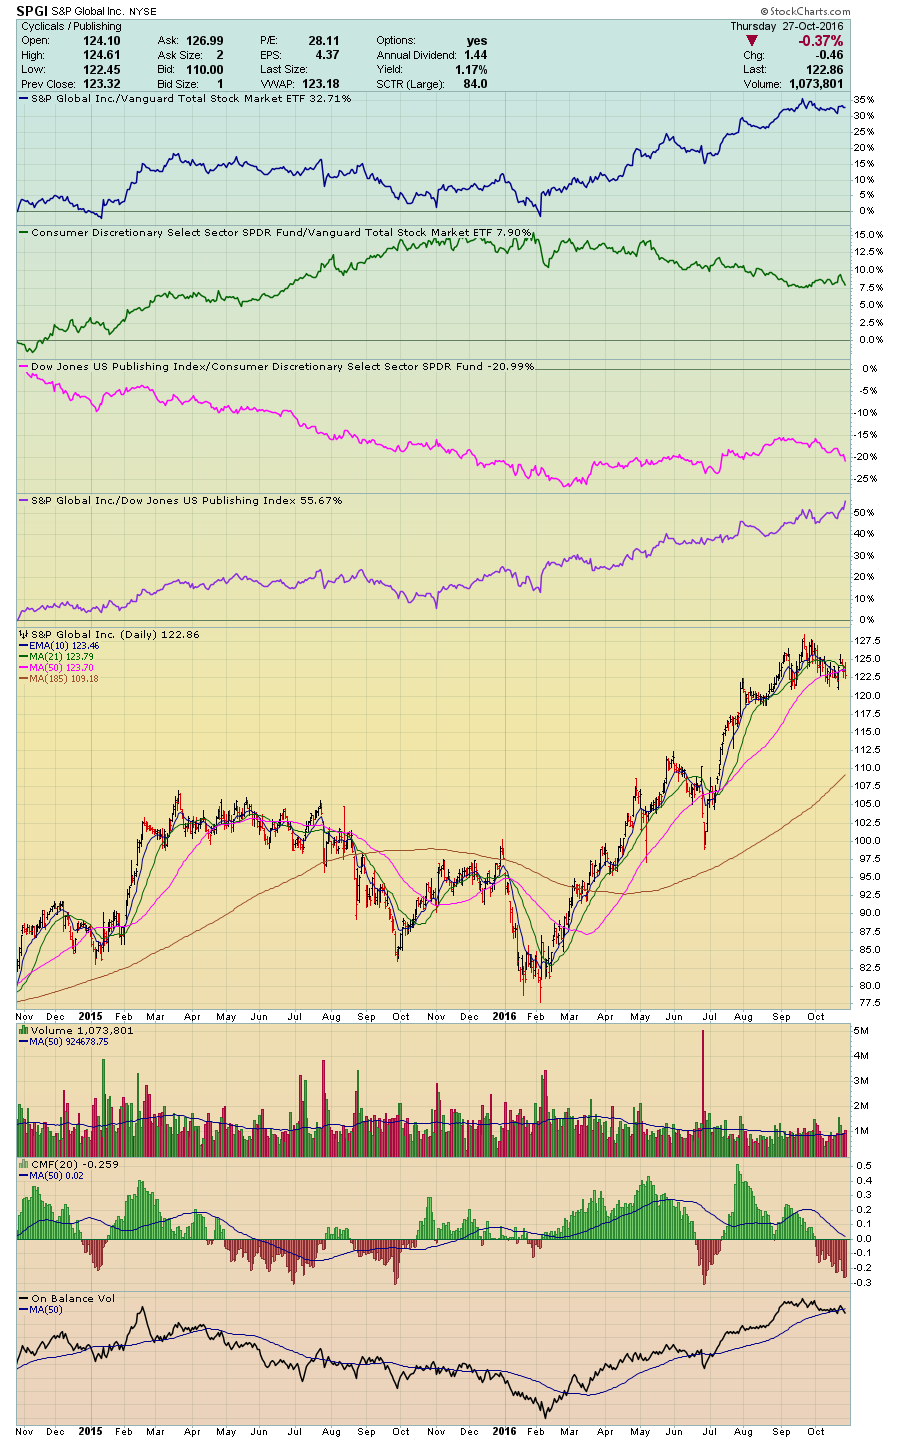
S&P Global (SPGI)
And here is why. For many years, I’ve profited from the quarterly reporting requirements of the top mutual funds as to their specific equity holdings. In fact, I’ll admit I do feel it’s unfair that they spend millions of dollars on analysts and research and then must disclose their best equity picks. But such are the rules. Who am I to look away instead of earning some trading profits on their coattails?!
We’ve formalized this methodology in our quarterly ChartPack where we disclose the 40 Fidelity Select Sector Funds’ key buys and sells for the most recent quarter. This third quarter review presented another unique profit opportunity. The federal laws are about to change in titanic ways as to the fiduciary relationship between investors and their brokers. Our quarterly ChartPack update uncovered the fact that Fidelity’s interpretation of these new laws is to sell certain financial corporations such as E Trade (ETFC), Virtu Financial (VIRT), and T. Rowe Price (TROW) and to buy another variety of financial corporations with wide competitive moats. These are the companies that should profit from this new federal legislation. Obviously, Fidelity is voting with its purse and understanding that the big winners moving forward will be companies in the Financial Services sector, data providers, financial ratings and indexes, as well as trading exchanges. This is why we are stalking the four equities mentioned above.
 As with previous Action Practice exercises, we’ll revisit these in two weeks. Until then…
Trade well; trade with discipline!
- Gatis Roze, MBA, CMT
- Author, Tensile Trading: The 10 Essential Stages of Stock Market Mastery (Wiley, 2016)
- Presenter of the best-selling Tensile Trading DVD seminar
- Presenter of How to Master Your Asset Allocation Profile DVD seminar
- Developer of the StockCharts.com Tensile Trading ChartPack


