 When you revisit the Action Practice #14 blog, you’ll recall that I presented four equities chosen from Investor Business Daily’s 20 top-rated Big Cap stocks. (April 5, 2017 edition.) I asked you to choose the best equity from the following four: Western Digital (WDC), KLA-Tencor (KLAC), Priceline (PCLN), and Facebook (FB).
I have my own money in Facebook. I’ll step you precisely through my reasoning which is described in more detail on pages 56 — 60 of our book.
https://store.stockcharts.com/collections/beginner-resources/products/tensile-trading-1
Here then is the step-by-step Tensile Trading methodology for Facebook.
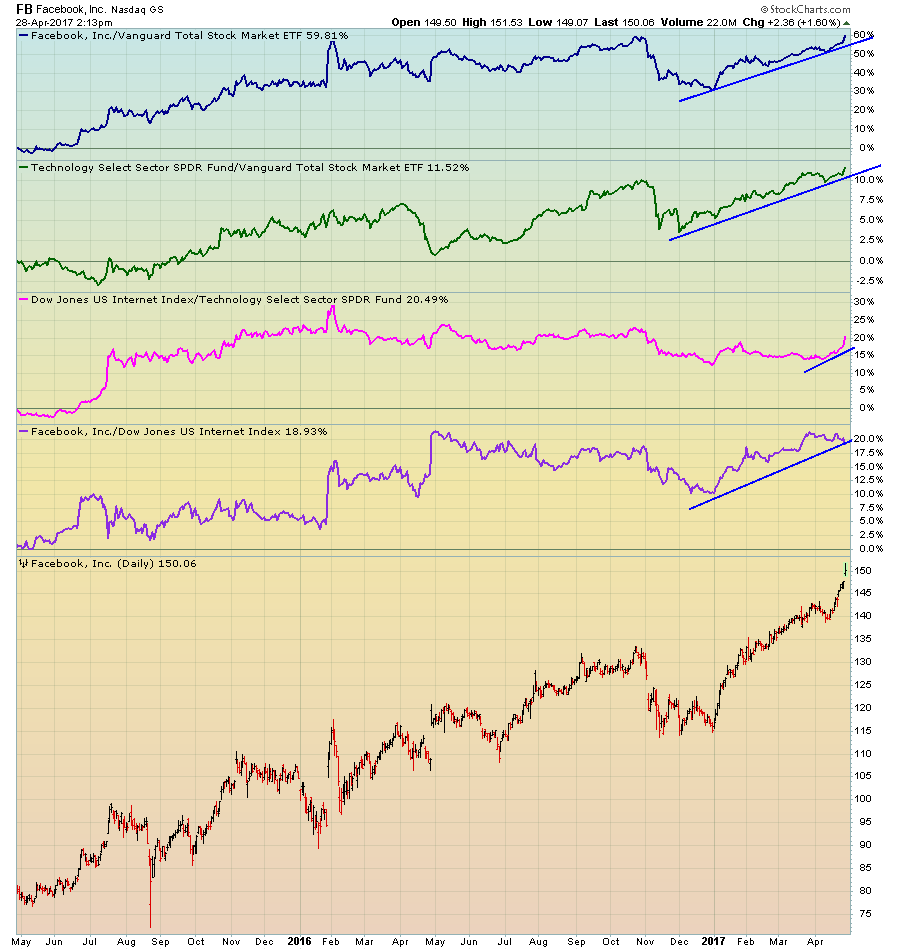
- Price Relative: The four graphs above the Facebook price chart clearly show that the winds of probability are aligning nicely. Facebook is outperforming the market (VTI). The Sector to which Facebook belongs (Technology) is also outperforming the market. Facebook’s Industry group is outperforming its Sector, and finally, Facebook is outperforming its brothers and sisters in the US Internet Industry Group.
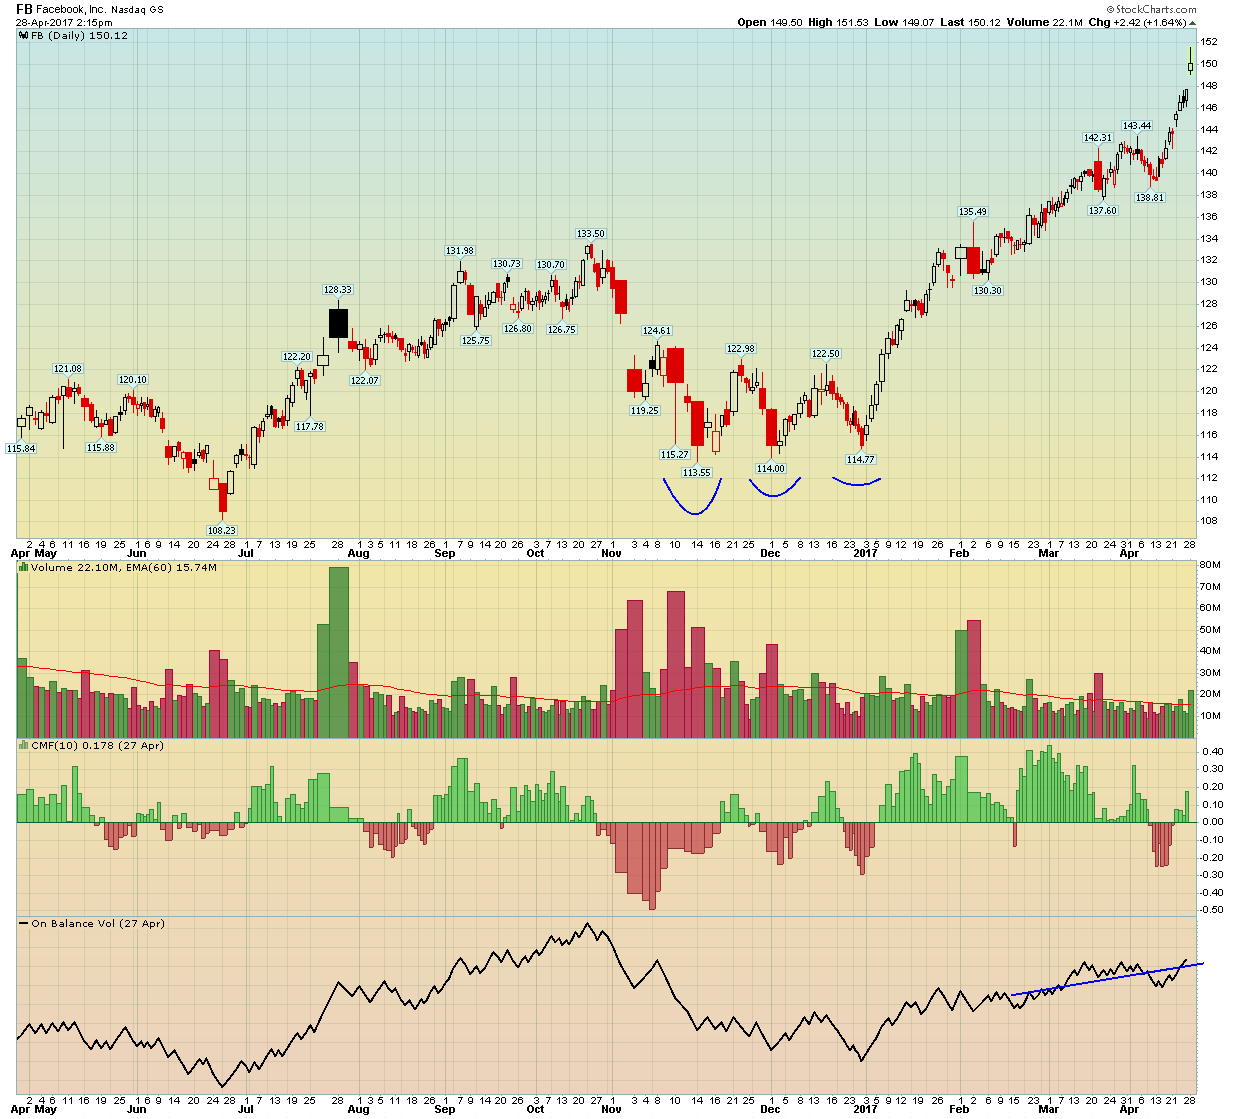
- Trend Indicators: The crucial question to ask always is “what is the trend?” I drew a trend line in by hand. Then I took note that all three moving averages are aligned and trending up. Finally, I glanced at ADX which confirms that Facebook is indeed in an uptrend.

- Volume Indicators: For myself, crucial evidence is the triple bottom created November through December, 2016. Three times, sellers tested the buyers in the vicinity of $113 - $114. The first test in November resulted in significant selling volume, but a retest in December resulted in significantly less selling. The final retest in late December produced very little selling volume and confirmed that the sellers were exhausted and the buyers could now take control. Indeed, both Money Flow indicators (Chaikin Money Flow and On-Balance Volume) broke out to the upside. With the shake-out completed over two months, Facebook was now poised to move significantly higher.
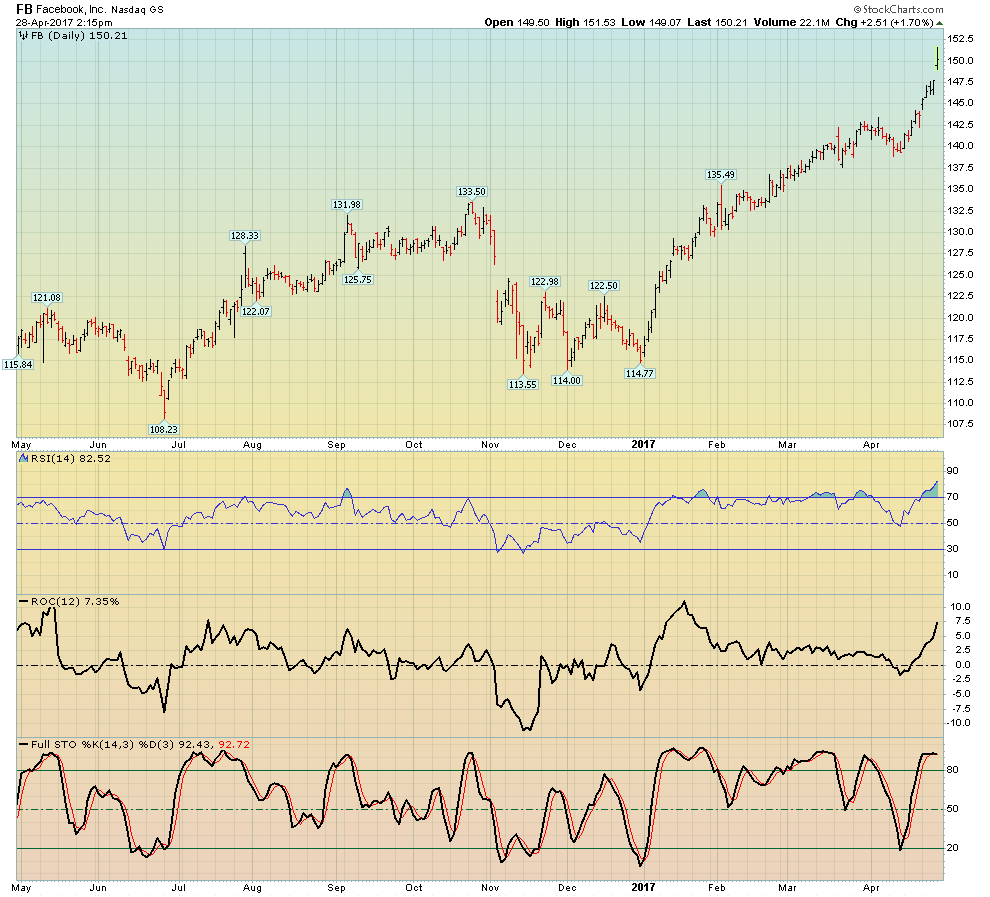
- Momentum: I like to consider three momentum indicators. It’s a signal when two of the three offer up a positive reading. Here, I show Rate of Change (ROC) which I like to see spending the majority of its time above zero. For RSI, I look for similar behavior above 50. I often swap stochastics and MACD. Facebook is confirming good momentum here.
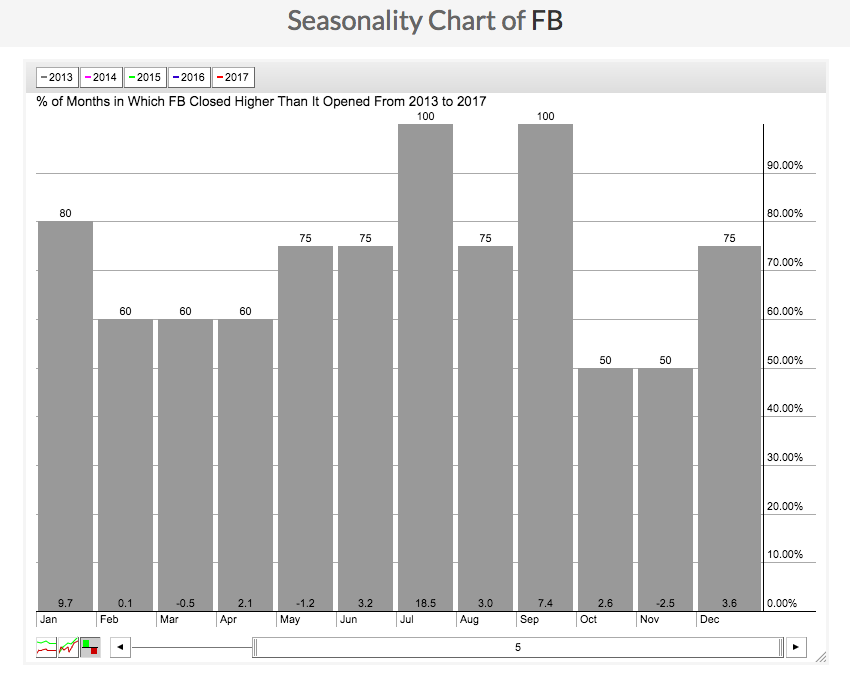
- Seasonality: Note how the seasonality chart is stepping up from 60% in April to 75% in May and June, and then up to 100% in July. This is based on the past 5 years of trading. In other words, Facebook is entering the season of strengthening prices based on historical behavior.
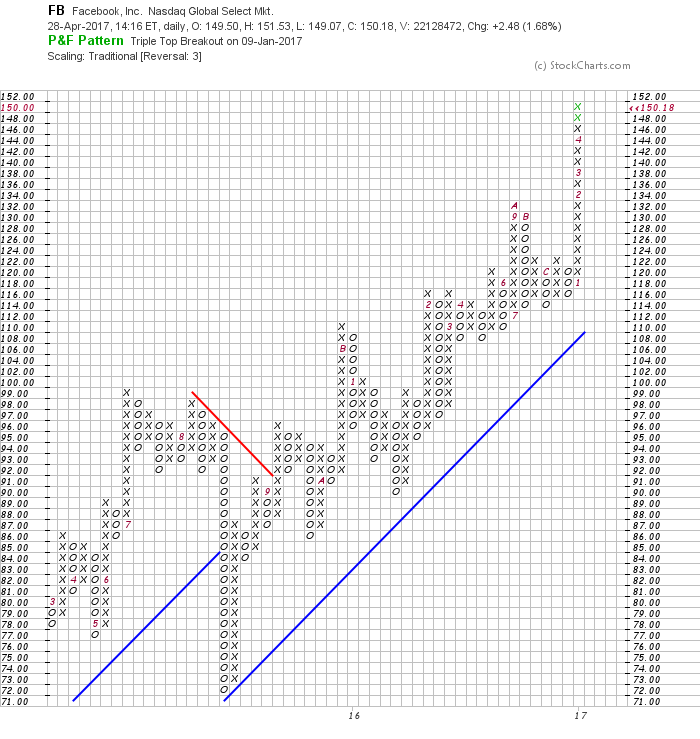
- Point & Figure Chart: For most of 2016, Facebook traded between 105 and 134 which created a reasonable base from which to spring out to the upside.
 In summary, it’s not complicated stuff once you organize the charts and save your formats. Just a few key indicators, but they offer up essential insights and the confidence to take on a position in an attractive equity.
This Week’s Action Practice:
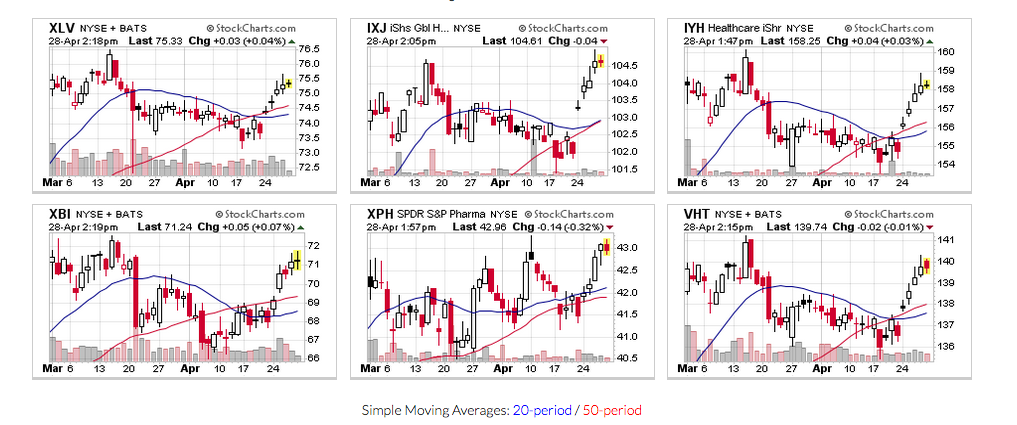
The challenge this week is to decide how to analyze six ETFs in the same Health Care Sector and then decide which one is the most appealing to you and why. A few hints. It’s not all in the charts. I suggest you investigate what the specific holdings are for each. Then review past volatility and other attributes, such as:
- expenses
- assets under management
- average daily trading volume
- average bid / ask spreads
- premium / discount to NAV
- concentration percentage in the top 10 holdings
- global exposure
- beta
- average market cap of holdings
Trade well; trade with discipline!
- Gatis Roze, MBA, CMT
- Author, Tensile Trading: The 10 Essential Stages of Stock Market Mastery (Wiley, 2016)
- Presenter of the best-selling Tensile Trading DVD seminar
- Presenter of How to Master Your Asset Allocation Profile DVD seminar
- Developer of the StockCharts.com Tensile Trading ChartPack


