 It’s hard to believe but exchange-traded funds (ETFs) have been with us now for 24 years. Who would have guessed? Perhaps John Bogle.
As a rule, investors buy Sector ETFs to smooth out the ride and decrease volatility. The classic measurement of volatility is, of course, the statistical measurement of standard deviation which shows investors how far a series of returns swings from the average returns over a time period of their choosing.
I maintain that by peering into the Sector ETFs actual composition — studying the specific nature of their individual equities and the percentage of the ETF allocated to each equity — investors can actually achieve a very accurate picture of potential future volatility for the ETF in question.
Whichever cliche you care to use — “you are guilty by association” or “you are the company you keep” — it is not only invaluable to unbundle ETFs and monitor their largest holdings, but it is foolish not to do so. This is specifically how and why we organize the ChartLists in the Tensile Trading ChartPack in this manner.
For example, the ChartList #407 for the SPDR Energy ETF (XLE) is populated with the 8 largest individual equities that comprise XLE. The key takeaway from the PerfChart in Action Practice #18 blog is to notice how much XLE, Exxon (XOM) and Chevron (CVX) are correlated together. The reason is simple.
http://stockcharts.com/articles/journal/2017/07/charts-im-stalking-action-practice-18.html
These top two equities alone account for over 38% of the Energy sector ETF (XLE). No wonder all three move pretty much as one . It’s important to know this as an investor for a number of reasons we’ll explore. Contrast this to the Industrial Sector ETF (XLI). Notice that the PerfChart of XLI, General Electric (GE) and 3M (MMM) are far less correlated than XLE. Once again, the reason is simple. Here the top two holdings — GE and MMM — account for less than 13% of XLI.
This indispensable lesson may be applied to all ETFs (and mutual funds). Investors need to investigate the percentage weightings of the top 10 equity holdings which comprise the ETF in question. With this information, the challenge is to construct effective ChartLists that reflect these realities. This discipline will mightily add value to both your monitoring and selling efforts as well, so don’t sidestep this routine.
For example, when your ChartList of XLI also contains the top holdings of the Industrial sector ETF, you will witness money flows (either accumulation or distribution) much more clearly than by simply monitoring XLI alone. I have found this to be a very profitable benefit for both monitoring and selling decisions.
Another very important reason to unbundle ETF holdings is to better compare and contrast similar ETFs. In the Biotech arena, for example, if you simply purchase the lowest cost (expense-wise) ETF without comparing and contrasting their individual holdings, you’ll be buying a virtual blind pool. Try it yourself on BBH, IBB, XBI, FBI and BIB. Just because it has Biotech in the title does not mean it is precisely what you are looking for.
It’s been my experience that making this extra effort and doing some due diligence during the shopping for equities phase, will flow dollars to your bottom line. Yet another reason to unbundle ETFs is to truly understand their holdings and not be bamboozled by their clever marketing labels, such as “smart beta”, “strategic beta” or “alternative beta” ETFs.
Transparency matters in ETFs — much like it does in so many domains in life. When you compare equally attractive International ETFs — VEA versus IEFA — their expense ratios are 0.07% and 0.08% respectively. But their performance differs because IEFA has far more German and French stocks and zero exposure to Canada. Understanding that matters. Unbundling makes it possible.
Finally, if after reading the ETF’s description of its strategy and after looking at the composition of its holdings, you are still left in a cloudy fog with respect to its mission, then perhaps the investment is too esoteric and complicated. Move on.
This Week’s Action Practice Exercise:
This is somewhat like a corollary to the previous Action Practice. Nevertheless, I believe it’s very appropriate to “close the circle”, so to speak. The reality is that the markets operate within the law of groupings. When you buy an equity, it will seldom levitate independently of the market, its sector, its industry group and its sister stocks. It is imperative, therefore, that you properly assemble a ChartList which reflects these realities.
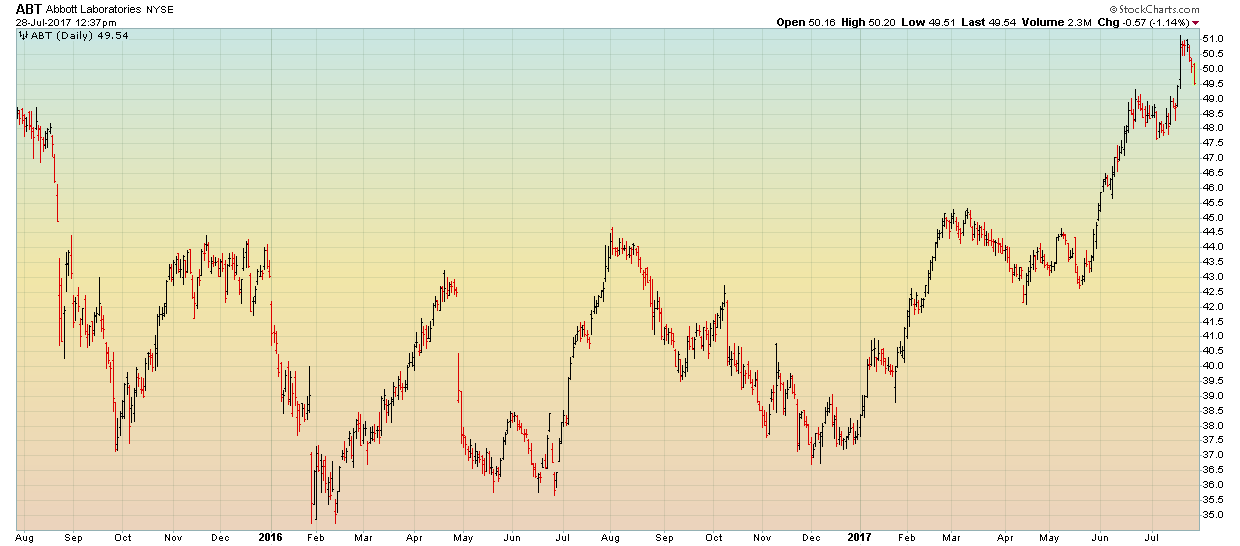
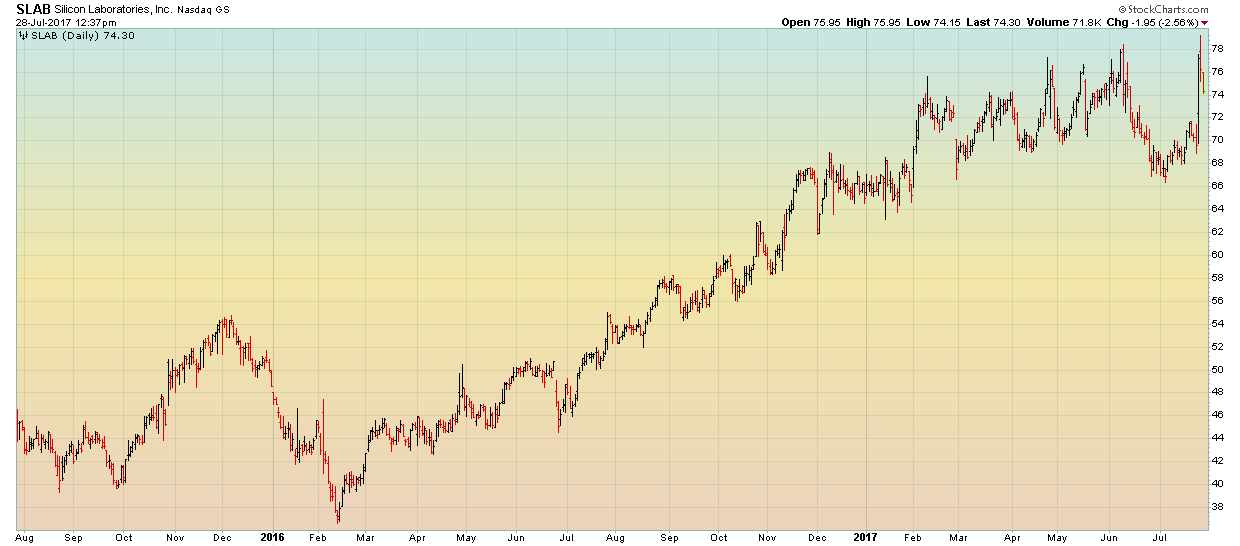
The assignment this week is to assume that you bought both of these equities — Abbott (ABT) and Silicon Labs (SLAB). Construct a ChartList for each, populated with the ticker symbols you deem most appropriate to monitoring your new purchase. HINT: For those of you who have downloaded the ChartPack, perhaps look there for some helpful ideas. Good luck!
Trade well; trade with discipline!
- Gatis Roze, MBA, CMT
- Grayson Roze
- Author, Tensile Trading: The 10 Essential Stages of Stock Market Mastery (Wiley, 2016)
- Presenter of the best-selling Tensile Trading DVD seminar
- Presenter of the How to Master Your Asset Allocation Profile DVD seminar
- Developer of the StockCharts.com Tensile Trading ChartPack
