I'm often asked about how technical indicators work across different time frames. The short answer is "Yes, they work." The longer answer, which explains how you need to use the toolkit differently depending on your time frame, follows.
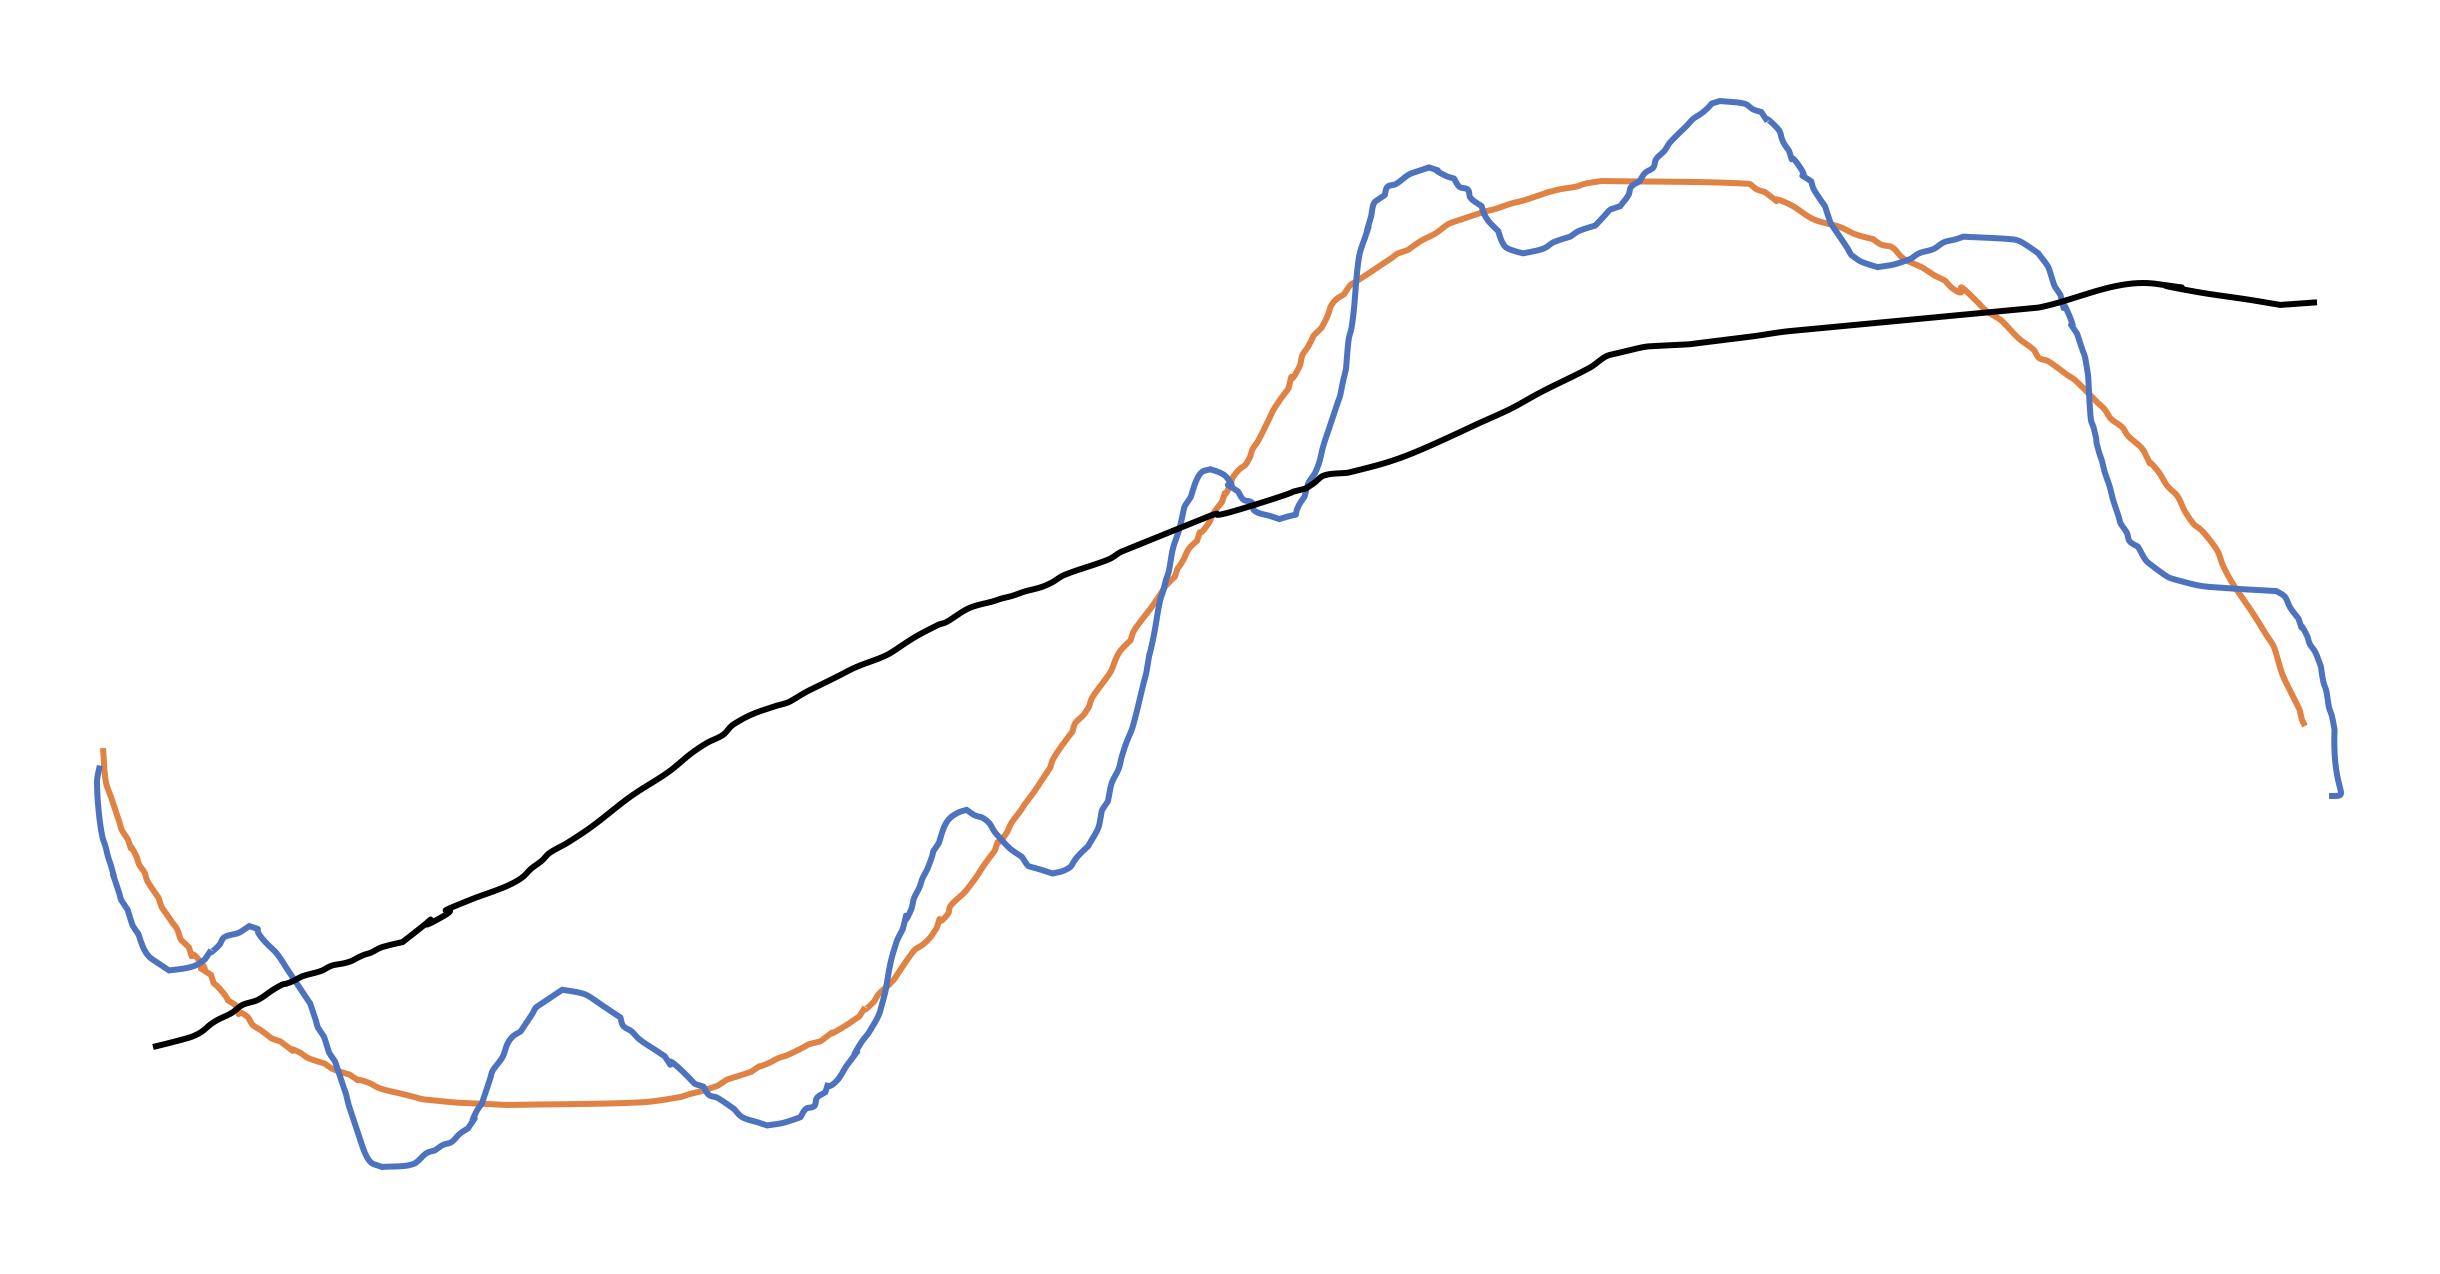
Many investors have a tendency to lock themselves into a particular timeframe, where they forget that they are also subject to market dynamics on other timeframes as well. Let's say that the orange line in the drawing below represents the price of a stock on your normal investment timeframe. Let's also say your investment horizon is around 6-12 months. You're basically trying to anticipate where that orange line is headed.

What you have to remember is that the simplified price, as illustrated by the orange line, is not happening in a vacuum. The orange line is actually formed from a shorter timeframe of peaks and valleys and represents the short-term price action. But there is also a longer-term timeframe of multi-year cycles, which we might call the business cycle. This is where sectors and themes come in and out of favor.
Now that we've added these additional components, the price illustration looks like this:

Besides trying to anticipate where the orange line is headed, you also have to deal with the short-term fluctuations of the blue line, as well as the long-term trend of the black line.
This is the reality of the investment game. You're always subject to the whims of timeframes on which you're not trying to operate!
Here's how I like to explain the uses of technical analysis across these three time frames:
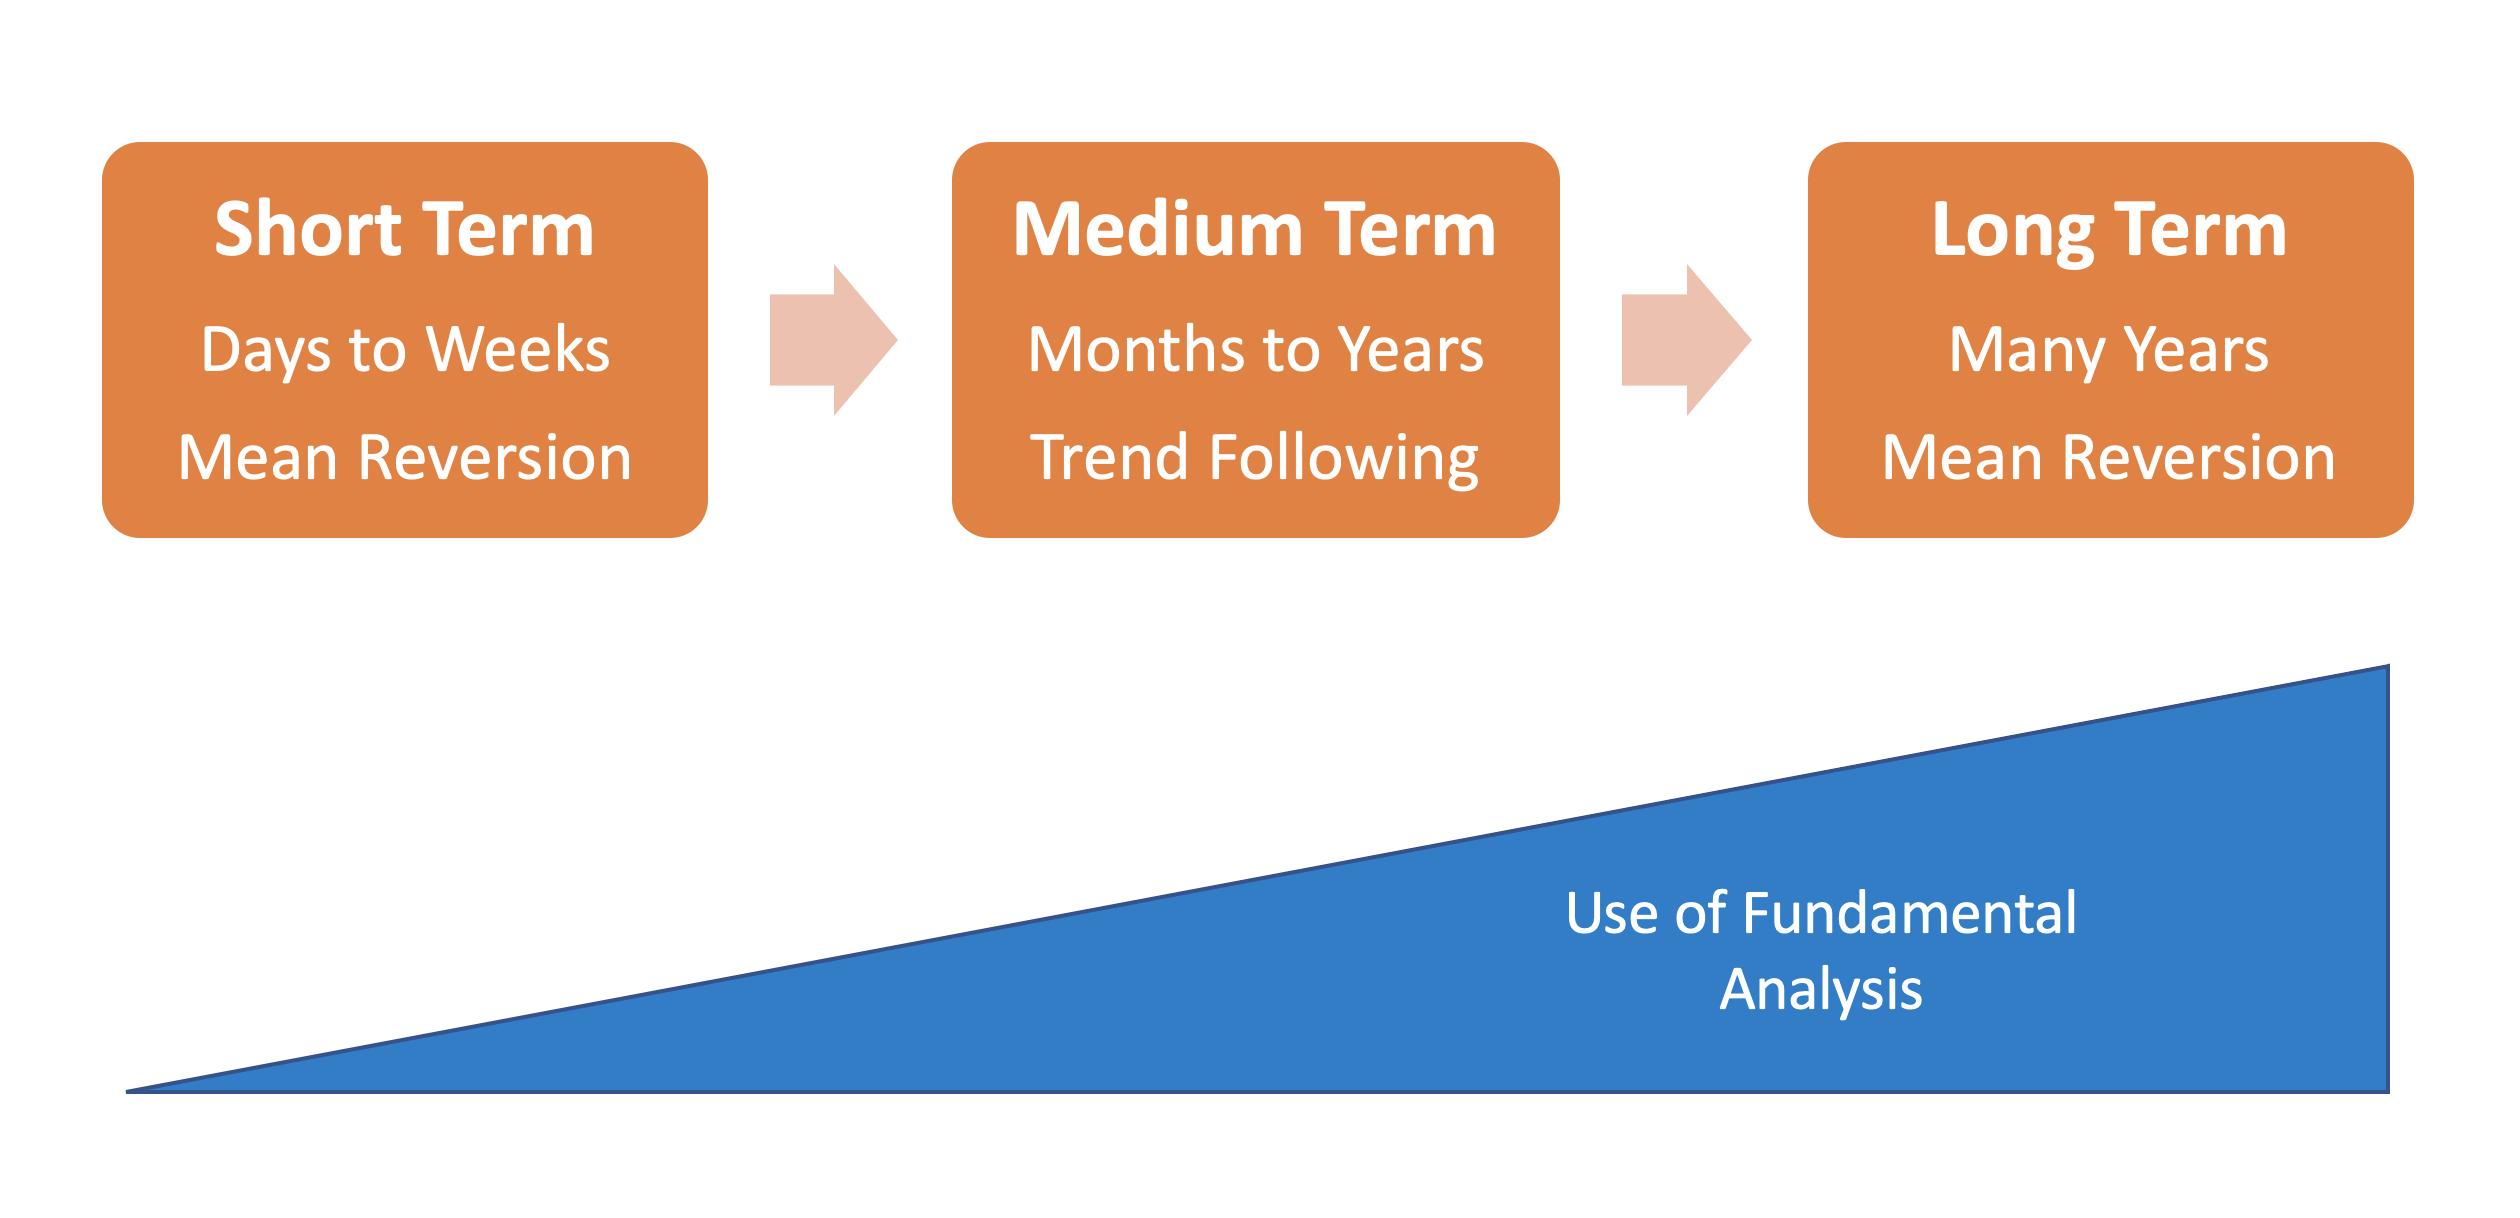
In what I call the short-term market, which runs from a couple days to a couple weeks, the markets tend to mean revert. That means they essentially move back and forth and settle into the intermediate-term trend. So, if you're focused on this timeframe, you should be buying weakness and selling strength.
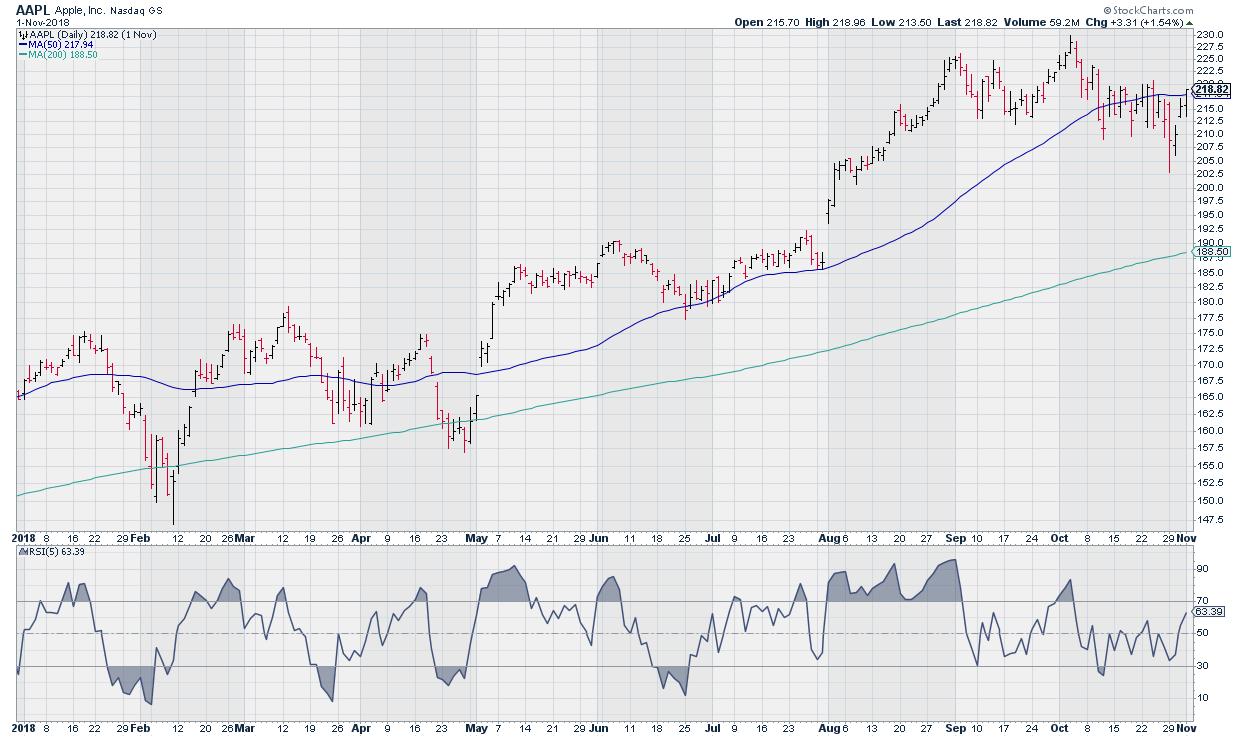
An indicator like RSI can be used to anticipate turning points on this timeframe. Notice how, on the chart of AAPL, the peaks and valleys in the RSI tend to coincide with the peaks and valleys in the 5-day RSI.
You'll also notice some divergences appearing, such as the lower peaks in the RSI in September and October that line up with higher highs in price. This suggests a weakening of momentum on that final push higher in price.
The intermediate-term timeframe is the sweet spot for trend followers. On the 6-12 month timeframe, market trends tend to persist. In other words, you should be buying strength and selling weakness. This is where most institutional investors operate, this is why the momentum factor works, and this is why most institutions are trend followers.
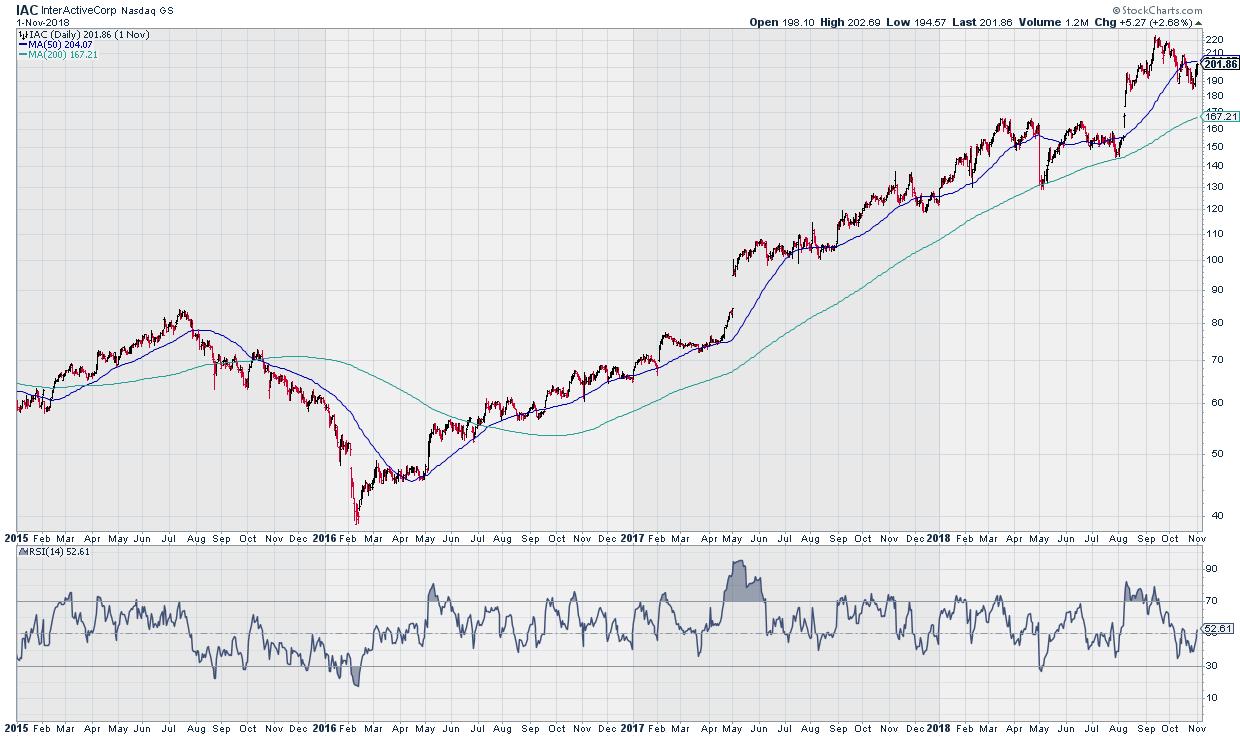
This chart of IAC above shows how RSI can be used less for mean reversion and more for trend following. The stock entered a downtrend in mid-2015 and, as the price moved lower, the RSI fluctuated between 20 and 60. Once a new uptrend emerged in 2016, the RSI moved up to the 40-to-80 range. So, essentially, the range of the RSI confirms the overall trend of the stock. In a bullish phase, as long as the RSI remains above 40, the uptrend will likely remain intact.
You'll notice in my illustration of the three timeframes that I indicated how much fundamental analysis should be used. On the short-term timeframe, where markets tend to mean revert, technical analysis is essential, as there is very little fundamental data that resonates for that time frame.
The intermediate term timeframe suggests a "fusion approach," or a blend of fundamental and technical analysis. Here, we can capture price momentum and follow trends, as well as line up those inputs with fundamental factors, e.g. earnings growth and profit margins.
On the longest timeframe, I would argue that technical analysis becomes less and less relevant because, in the end, stocks trade to their fundamental valuation.
The real benefit of technical analysis is taking advantage of the shorter timeframes, where stocks disconnect from their valuations. For long-term investors, understanding the relationship between the mean reversion of the short-term and the trends of the intermediate-term will allow you to maximize returns and avoid whipsaws.
RR#6,
Dave
David Keller, CMT
Chief Market Strategist
StockCharts.com
