TAKEAWAYS
- While the long-term trend in Apple has been quite strong, the weekly charts shows a clear double-top pattern with declining momentum.
- Our Market Trend Model currently reads short-term bearish, medium-term bearish, and long-term bullish.
- A break below price support around $169 could open the door to further downside, and would suggest further underperformance for this former market leader.
 The big news for Apple Inc. (AAPL) this week was a huge antitrust case from the US government. While the outcome of that particular situation is uncertain, one reality that has been quite certain is that AAPL is no longer pounding higher like its "magnificent" brethren.
Today we'll show how the technical picture for Apple has gone from bullish to neutral to bearish, why multiple timeframes can be super valuable in separating the signal from the noise, and how we can identify potential downside objectives for stocks in breakdown mode.
I was taught, "When in doubt, zoom out." So, with that in mind, let's start with the weekly chart.
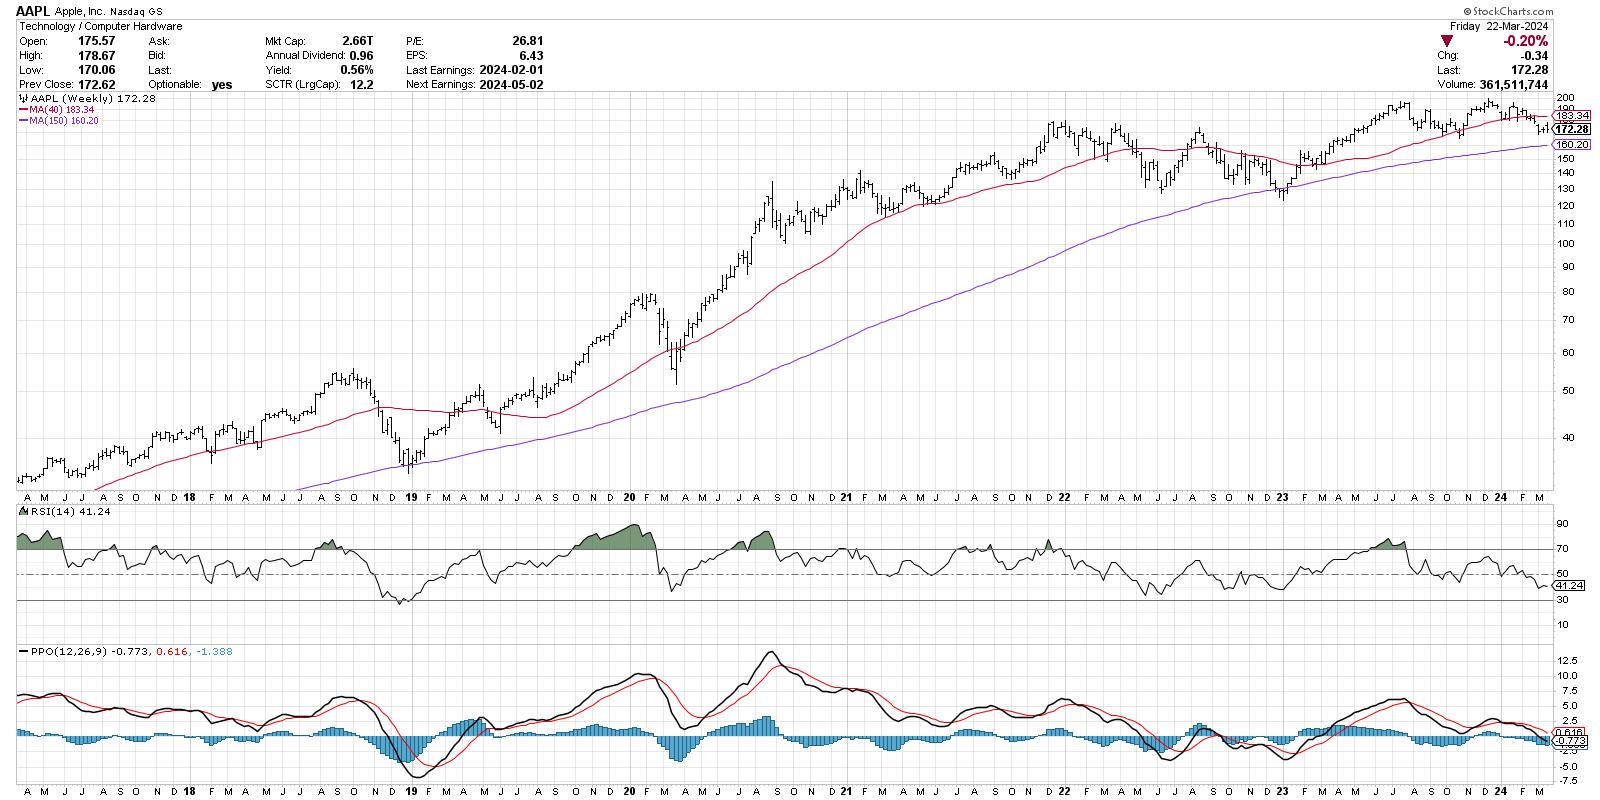
Three things stand out as I review the last seven years of Apple's price history. First, the long-term story is quite constructive, with the stock going from below $40 to almost $200 in less than five years. The 150-week moving average, one of my favorite long-term gauges of trend, has been sloping higher, and numerous tests of the 150-week moving average on the way up have held just fine.
Second, we observe a couple breaks of the 40-week moving average, which I use on the weekly chart because it lines up well with the 200-day moving average. The last time we had a confirmed break of the 40-week moving average was in Q2 2022, which ended up leading to an additional decline until the eventual low in December 2022.
Finally, the PPO indicator generated a sell signal in July 2023, when the PPO line broke down through the red signal line. This pattern tends to occur after a long bull phase, and suggests that the July peak was a meaningful one for AAPL.
The next chart we'll review uses my Market Trend Model, a proprietary model based on a set of weekly exponential moving averages. This model gives a trend signal for three time frames: short-term (a couple days to a couple weeks), medium-term (a couple months), and long-term (over a year).
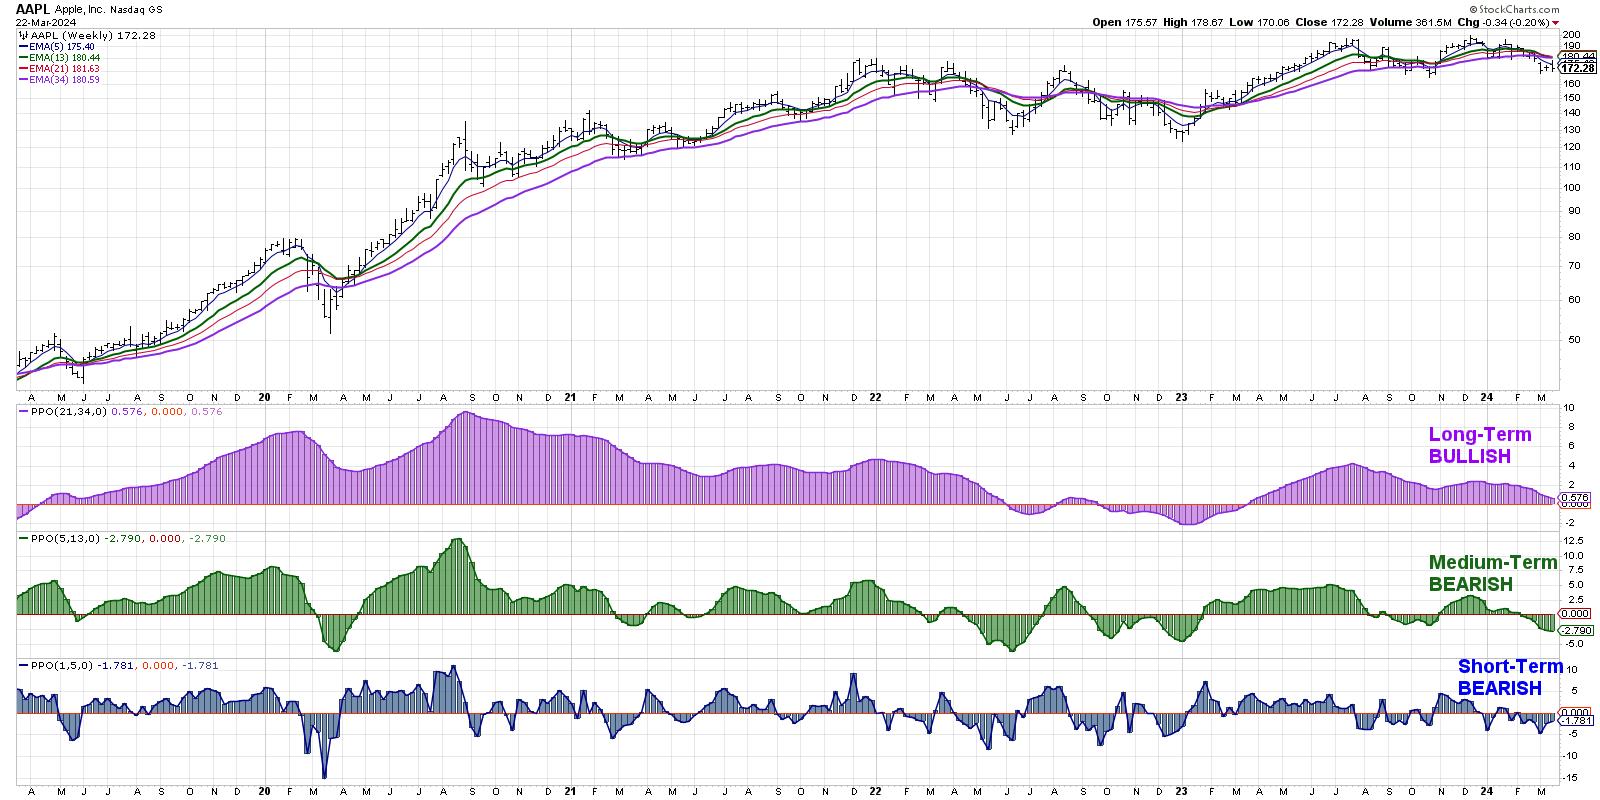
At this point, the model is reading short-term bearish, medium-term bearish, and long-term bullish. This lines up with our initial review of the weekly chart, in that the long-term story appears constructive, but the evidence has been mounting in recent months that the July 2023 high was a significant one for the stock. It's worth noting that the long-term model is very close to turning negative, which would be the first bearish signal since September 2022.
Now let's check the daily chart to see how last week's price action relates to the longer-term trends we've observed thus far.
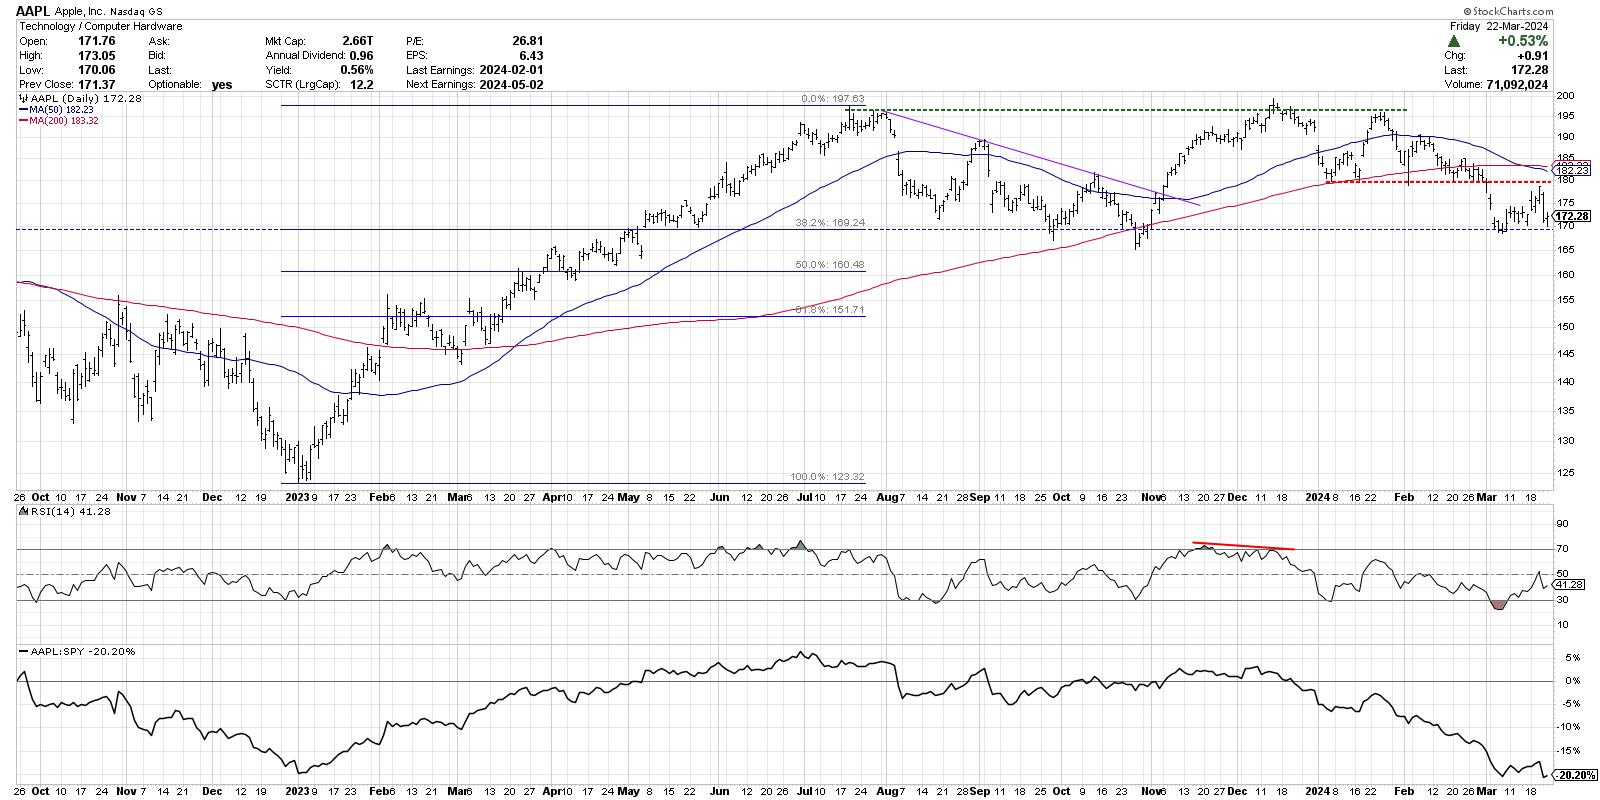
Here, we can see the double top pattern where the December 2023 high lined up almost perfectly with the July 2023 high. After a subsequent retest of this resistance level in January 2024, Apple dropped from a peak just below $200 to its recent swing low around $169.
Taking the January 2023 low and July 2023 high as a framework, we can use Fibonacci retracements to identify potential downside targets. The 38.2% level hits right around $169, which lines up with the September and October 2023 lows, as well as the recent price action for AAPL.
The red-dashed line represents a support level drawn from the January 2024 test of the 200-day moving average. There were four additional tests of this support level before AAPL finally broke below at the beginning of March. The last few weeks have seen Apple bounce between support around $169 and resistance around $180, giving us a fairly clear range with which to consider the next move for this key growth stock.
If AAPL would break below this confirmed support level around $169, that would represent a new 10-month low and open the door to further support around $160, and perhaps even the 61.8% retracement level around $152. If, however, investors become optimistic on Apple's prospects despite the recent antitrust claims, a break above $185 would mean a valid break above resistance as well as the crucial 200-day moving average. In that case, a retest of the all-time highs around $200 would seem a plausible scenario.
The most concerning feature of this chart, by far, would be the declining relative strength in the bottom panel. The downtrend in this series shows that while Apple has begun its short-term decline off all-time highs, the stock has underperformed the S&P 500. Owning names that underperform the S&P 500 is a sure way to underperform the S&P 500 in your portfolio!
While this week's news on Apple has caused many to revisit a bullish thesis on this long-time winning stock, a thorough review of the weekly and daily charts tells a potentially dire story that has been building for months. Mindful investors know that technicals tend to lead the fundamentals, and a weakening chart is usually a sign of an ominous future!
RR#6,
Dave
P.S. Ready to upgrade your investment process? Check out my free behavioral investing course!
David Keller, CMT
Chief Market Strategist
StockCharts.com
Disclaimer: This blog is for educational purposes only and should not be construed as financial advice. The ideas and strategies should never be used without first assessing your own personal and financial situation, or without consulting a financial professional.
The author does not have a position in mentioned securities at the time of publication. Any opinions expressed herein are solely those of the author and do not in any way represent the views or opinions of any other person or entity.
