Accessing the RRG chart tool from the home page will bring up a number of major index as the default universe. The drop down box labelled "pre-defined" groups will show a number of, indeed just like the title says, pre defined groups for use on a Relative Rotation Graph. One of these groups is the "S&P 500 sector ETFs". I am sure this will become one of the most used universes for RRGs on the StockCharts site as well as in my blog going forward.
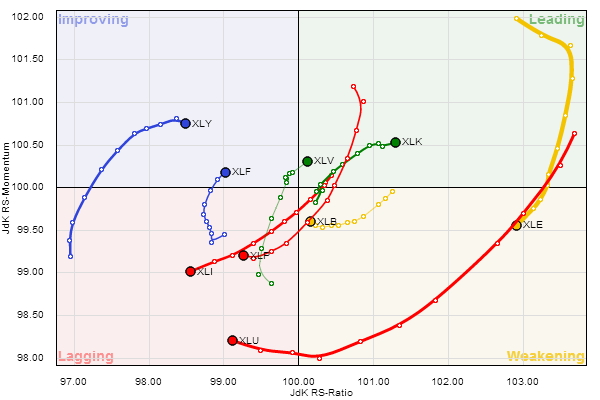
When I look at the RRG chart above there are two sectors that immediately catch my attention. These are XLK (Information Technology) in the leading quadrant and XLI (Industrials) in the lagging quadrant. Primarily because they are moving almost exactly opposite of each other.
XLI is inside the lagging quadrant and heading deeper into it at an almost negative 45 degree angle This indicates a very steady dropping relative strength line with the JdK RS-Ratio and the JdK RS-Momentum both moving lower at the same time. This can clearly be seen on the price chart in combination with the RRG-lines.
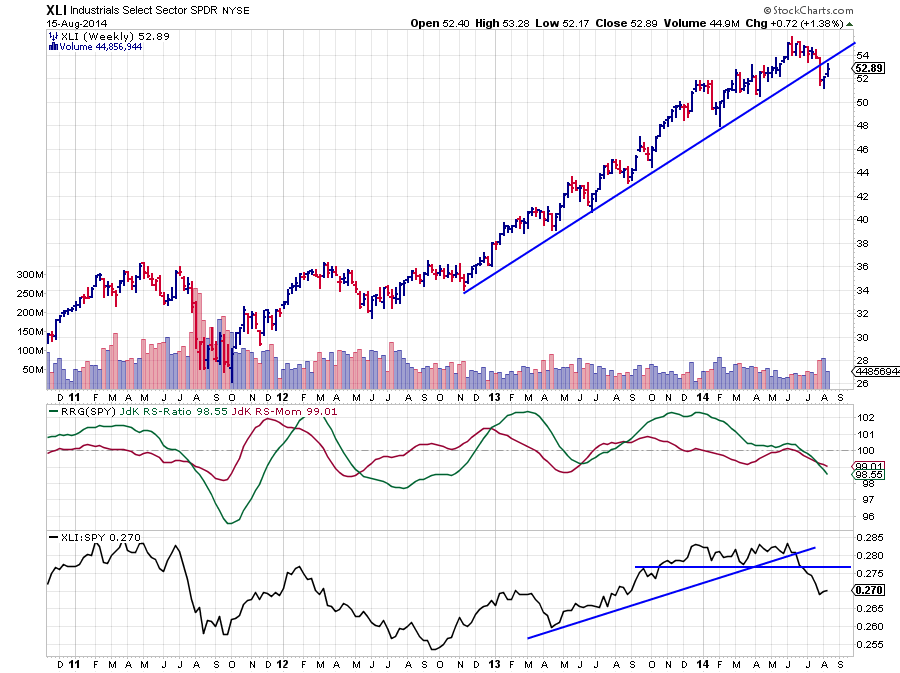
The break down below the rising trend-line on the price chart in combination with the weak relative strength picture, Both RRG-lines below 100 and a clear break down on the raw RS-line indicate more relative weakness ahead for the Industrials sector.
The Information Technology sector on the other hand, ticker XLK, is pretty much the exact opposite of Industrials. This sector is moving inside the leading quadrant already and heading deeper into it at a nice nearly 45 degree angle. When seen on a price chart in combination with the RRG-lines this comes down to a steady rising relative strength line and both RRG lines moving higher.
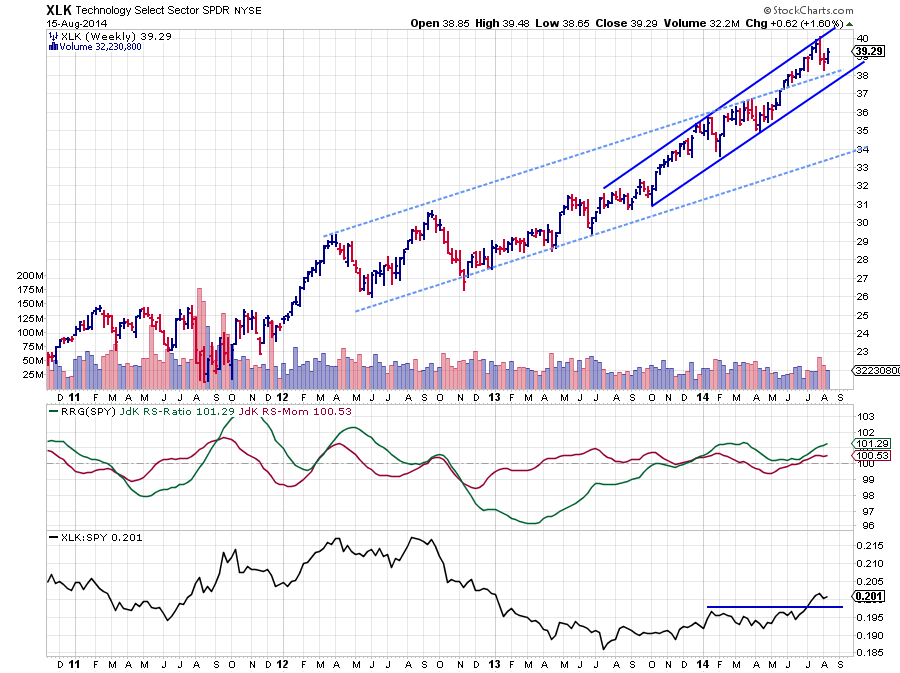
The relative outlook for XLK is undeniably strong, the raw RS-line has broken a horizontal resistance level and both the JdK RS-Ratio and the JdK RS-Momentum are moving above the 100-level. Combine that with an upward break out of an, already rising trend-channel and we have a sector that seems to have more strength coming its way. The recent dip back to the former rising resistance line of the longer-term channel (dashed lines) which started to act as support, underscores the current strength of the Technology sector.
Obviously we would like to catch such moves in its early stages. In order to do so, what would we be looking for on a Relative Rotation Graph? Let's first examine the XLK:XLI chart below. This chart shows the price chart (weekly bars) of XLK in combination with the RRG-lines and the raw RS line against XLI.
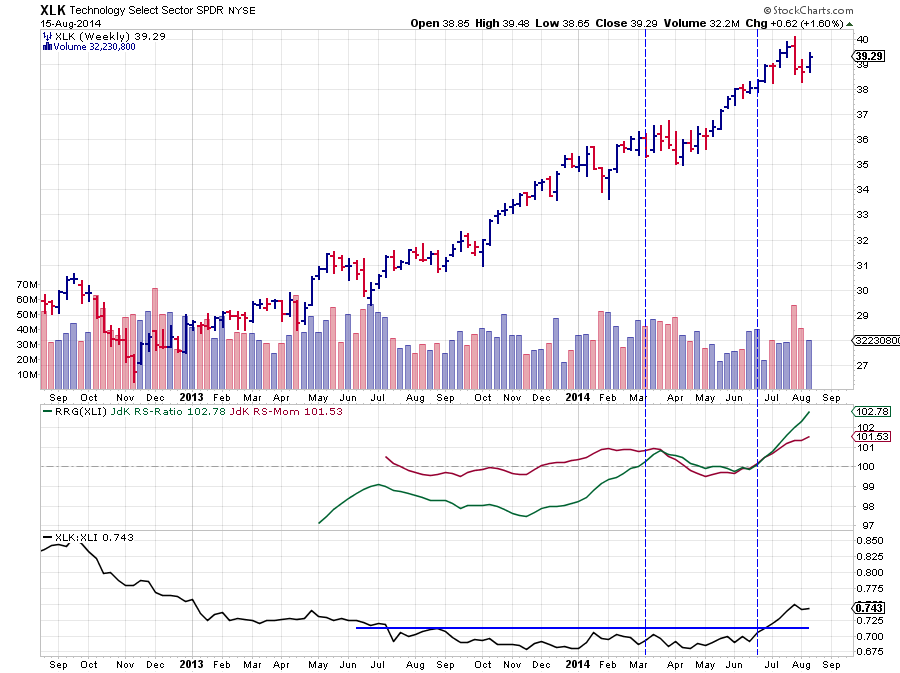
The first indication of relative strength picking up was given back in March but there was not a lot of follow through. The RRG lines dropped back to the 100-level and remained there, indicating the flat behaviour of the raw RS-line. Late June the RS-Ratio line started to pick up again, backed by a rising RS-Momentum line. A few bars later the RS-line itself crosses above the horizontal resistance level that had been in play for nearly a year and XLK starts to move away from XLI. Such a 'start of a trend' can be detected on a RRG by looking for two symbols that are crossing an imaginary vertical line in opposite directions. Such contra-directional moves often indicate the start of a new relative trend between the two ticker-symbols at hand. See the RRG chart below for more clarification.
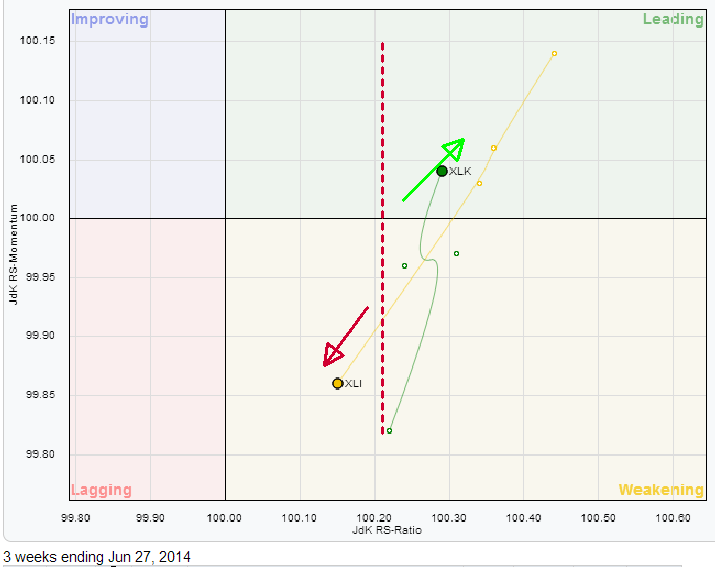
The dashed vertical line is the same as the 100-level on the RS-Ratio axis with regard to the S&P 500 where crossings indicate a relative trend change of a sector against the benchmark. In this case it means a trend-change for the XLK:XLI pair which investor can try to benefit from.
- Julius
