The first time I wrote about international equity markets on this blog was last year in October. Already back then China had entered the leading quadrant on the Relative Rotation Graph holding a number of international equity indices. And if we look today we will see that China is still on the far right-hand side of the plot, indicating that the strong relative up-trend against the rest of the world is still fully intact.
So if you are short on time... the main takeaway from this article is that China is still strongly leading over pretty much any other equity market in the world and the rally has just been supplied with new fuel.
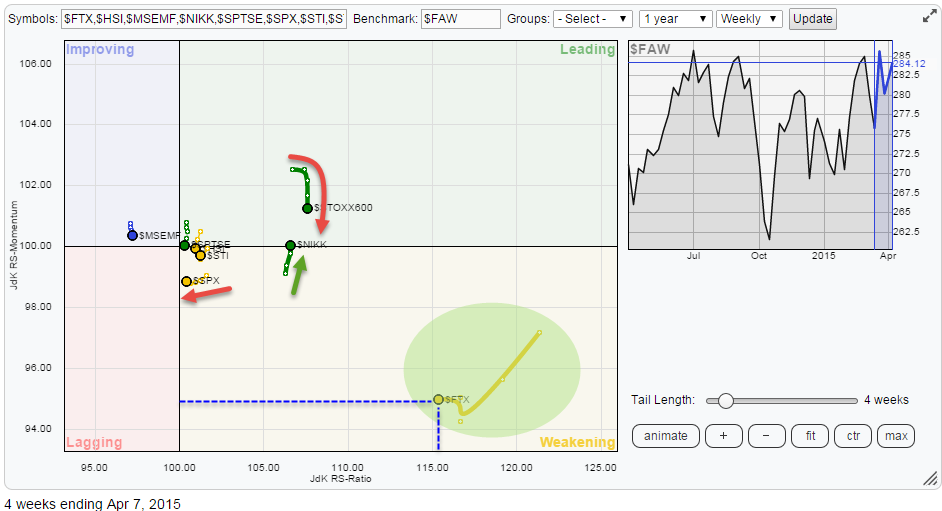
As you can see China is inside the weakening quadrant as the market went through a (temporary) loss of relative momentum. However, compared to all other observations on the plot $FTX is still way on the right of the RRG canvas indicating that a very strong relative trend is at play here. This positioning in combination with the shortening of the distances between the observations over the last few weeks leads to the belief that the Chinese market is ready to turn back up again and work its way higher on the JdK RS-Ratio axis as well.
Another interesting observation that can be made from the Relative Rotation Graph above is the collision course for the European STOXX 600 index ($STOXX600) and the Japanese Nikkei 225 index ($NIKK).
China ($FTX)
It's either getting boring or it remains interesting, just a matter of how you would look at things. But once again I cannot deny the Chinese market and have to put up a chart as it is, once again, so strong.
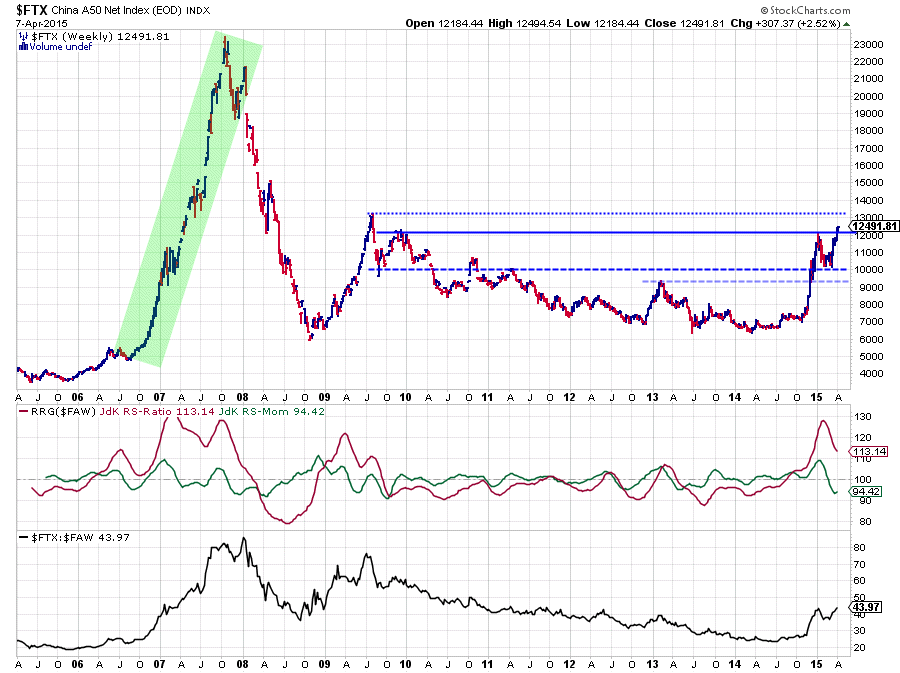
In order to put things into perspective i have used a long-term chart for $FTX. As we can see the bottoming out process started back in Q4-2014 when resistance levels around 7.500 and 8.000 were cleared seemingly without any effort. Relative strength and the RRG-Lines had already picked up steam prior (September) to price breaking beyond those resistance levels. As a result the Chinese market skyrocketed almost vertically and set a high near 12.000 in the month of December. Questions that pop up in everybody's head (c'mon be honest..) when such moves happen are:
- Too good to be true ? Not sure.
- Overstretched ? Maybe.
- Due for a correction ? Likely.
- The end of the up-trend / up-move ? Probably not!
Although nothing is impossible, especially when it comes to stock market price movements, it would be highly unusual for an almost vertical move without any correction to drop right back, without any recovery. Having said that, the hardest part occurs at moments such as December 2014 when $FTX hits a high and subsequently starts to correct. As the move was huge, around 60%, the ensuing correction(s) can be expected to be large in magnitude as well.
Following the pure definition of an up-trend "higher lows followed by higher highs" any corrective move could drop as far back as 7.000 without harming the freshly started up-trend.
In this case, luckily enough, there were a few past highs and lows that could serve as reference points (support) for us market-observers, to look at. And this is the reason it is so important to revert back to long-time charts when moves like this occur.
On the 10-year chart above the 10.000 level shows up as possible support level, as does ~9.500 coming off the early 2013 high. The long-term chart also reveals the resistance at 12.000 and the next one coming up around 13.000.
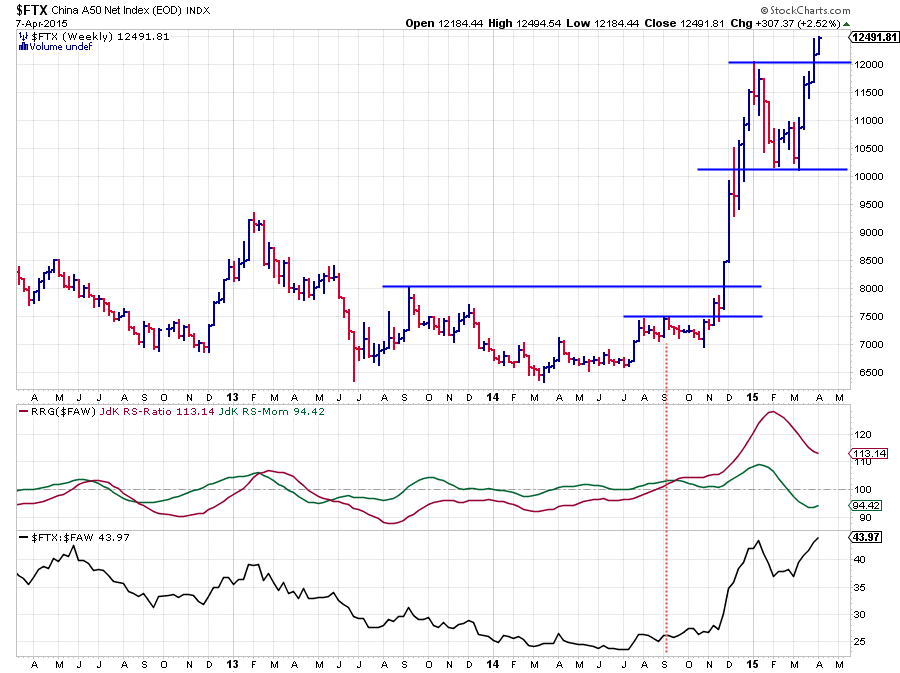
A regular 3-year chart (see small in-set), as I mostly use in my blogs, would not have revealed a few of these levels. Potentially blurring any analysis.
So what do we have now? As we can see the Chinese market pretty well respected the support level around 10.000 as it was tested twice in February and March. The added benefit here is that because of this double test at 10.000 a small double bottom emerged at that level, making a break below 10.000 a good trigger to call an end to the move and the break above 11.000 a perfect trigger for confirmation that the move is not over yet or to go back into the market or start participating (again).
The recent break above the 12.000 mark was yet another confirmation that a strong up-trend is well underway and heading for the next barrier just above 13.000. We'll just have to wait and see what will happen when that resistance gets cleared.
I have shaded the 2006-2007 move in this market to show that things have happened before. To quote Sir john Templeton "This time is different .... the four most dangerous words in finance"
Dow Jones STOXX Europe 600 Index ($STOXX600)
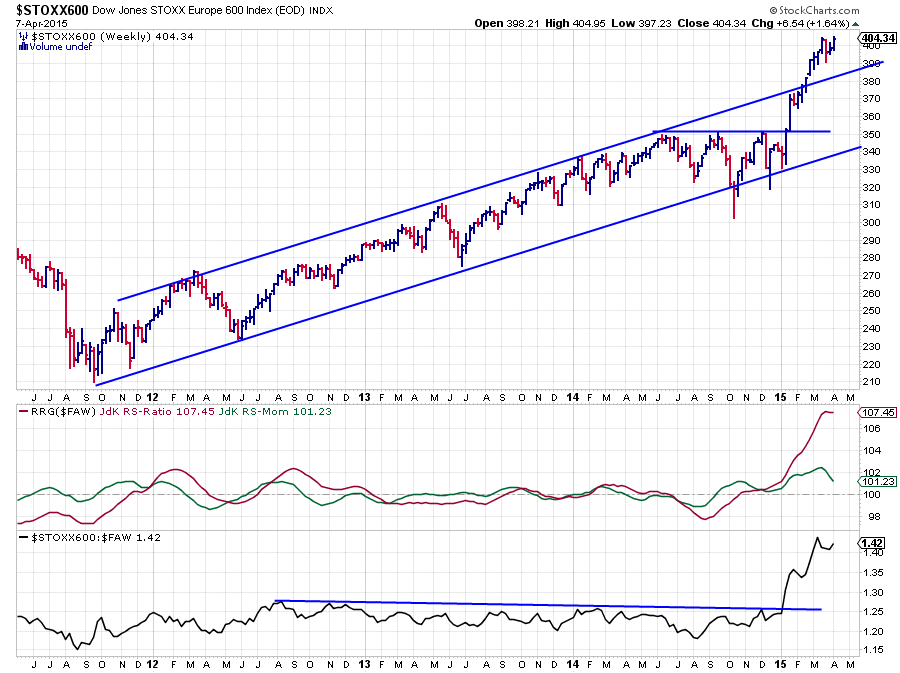
European stocks, represented by the Dow Jones STOXX Europe index make an interesting case on the Relative Rotation Graph. For the past few weeks $STOXX is heading almost straight down on the RRG but it is doing that at a relatively high level. As a matter of fact, the European market is the second strongest after the Chinese market.
The move down on the JdK RS-Momentum axis clearly indicates a loss of relative momentum but remaining at the more or less the same level at the JdK RS-Ratio axis indicates that the positive relative trend is still intact. Based on the position on the RRG chart (high RS-Ratio, still in leading quadrant) I still read this as a strong relative up-trend which is undergoing a correction.
This judgement seems to be confirmed by price action on a regular chart. First of all there is a long-term trend channel visible emerging out of the 2012 base. Then there is the inverse head and shoulders continuation pattern that was formed in the second half of 2014 with a break of the neckline in January 2015. The subsequent rally, after a small pause at the upper boundary of the channel, managed to break out of the already rising channel. indicating a very strong market.
At the moment the $STOXX600 index has reached its price target based on the inverted H&S pattern and seems to be hesitating. Just like we saw on the chart of $FTX the same questions do pop-up ....
For the $STOXX chart i am watching support levels offered by the former rising resistance line and in case of a drop back into the rising channel the 350 area, level of the neck-line and the lower boundary of the rising channel. As you can see a lot of downward price pressure will be needed from current levels in order to break the existing up-trend. Not something I would expect to happen overnight.
All in all this is still a very strong chart with room for a correction.
Tokyo Nikkei Average ($NIKK)
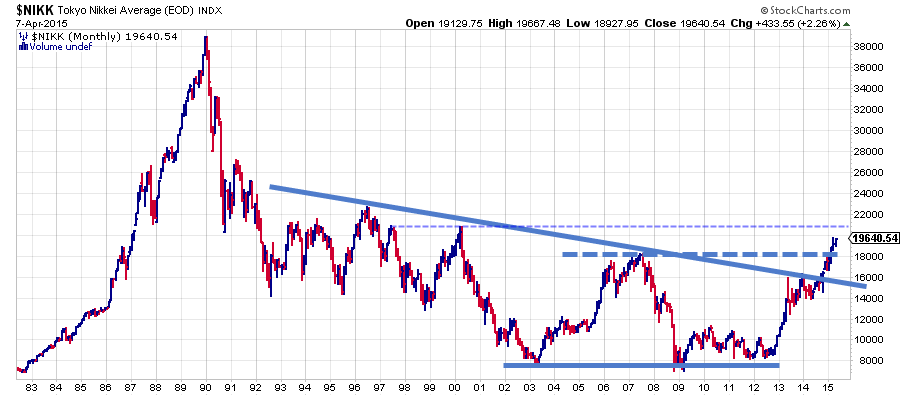
The Nikkei chart needs an even longer history to put things into perspective. I had to load a monthly chart from the StockCharts.com database to get proper reference points.
As we all know the Japanese market has been flying under the radar for almost two decades after things started to fall apart in the early nineties. Recent price action however seems to start shining some new light on this 'forgotten market'. The first improvements were visible back in 2013 when the Nikkei was able to lift itself from the basing pattern which was formed during the 2009-2013 period.
A very strong rally took the market up to the level of the falling resistance line, connecting all major highs since the early nineties. This level appeared to be heavy as steel as it took the market almost two years to digest all the supply in that area but the subsequent higher lows that were formed during that period indicated that buyers were hungry and prepared to get back at higher level after each correction.
 The resulting rising triangle was broken upwardly in November last year and we are currently still seeing the results of this break. The Nikkei continues to push higher and higher and has even managed to break above the rising resistance line visible in the small chart on the left.
All in all there seems to be a fundamental change in price structure underway for Japanese equities. i am keeping a close eye as this does not look like some one-off, isolated, move to me.
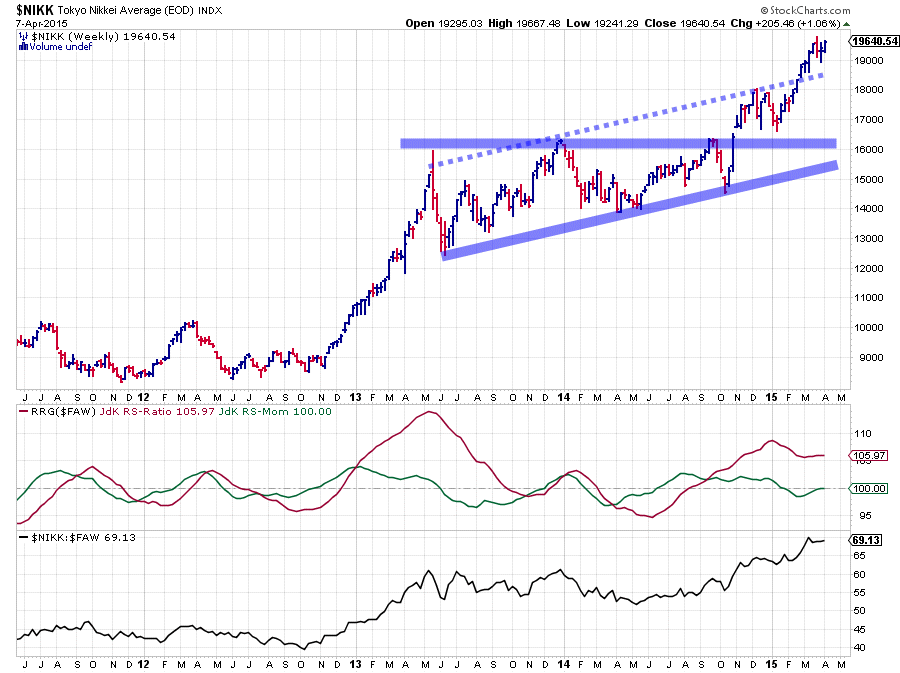
The accompanying relative strength lines and RRG-Lines speak clearly. A relative up-trend, on a weekly chart, already started in August 2014, before the Nikkei broke out of the rising triangle, and this up-trend is still fully intact.
During the recent loss of relative momentum, JdK RS-momentum dipped below 100, the RS-Ratio managed to remain at almost the same level above 100 indicating that the up-trend is still ongoing. Translated back to the RRG chart this means a rotation completely on the right hand side of the plot as we have seen it unfold. A scenario that is very likely for the $STOXX600 index as well.
Given the head-to-head collision course for both $STOXX and $NIKK on the Relative Rotation Graph the short-term trend may be in favor of Japanese equities over European but from a longer-term perspective they look both strong and are likely to outperform the "world" index.
Conclusion
- China flying off the charts, trend not over yet
- Europe maintaining strong relative trend
- Japan undergoing fundamental changes in price structure, relative trend picking up steam.
Julius de Kempenaer | RRG research
RRG, Relative Rotation Graphs, JdK RS-Ratio and JdK RS-Momentum are registered TradeMarks by RRG research.


