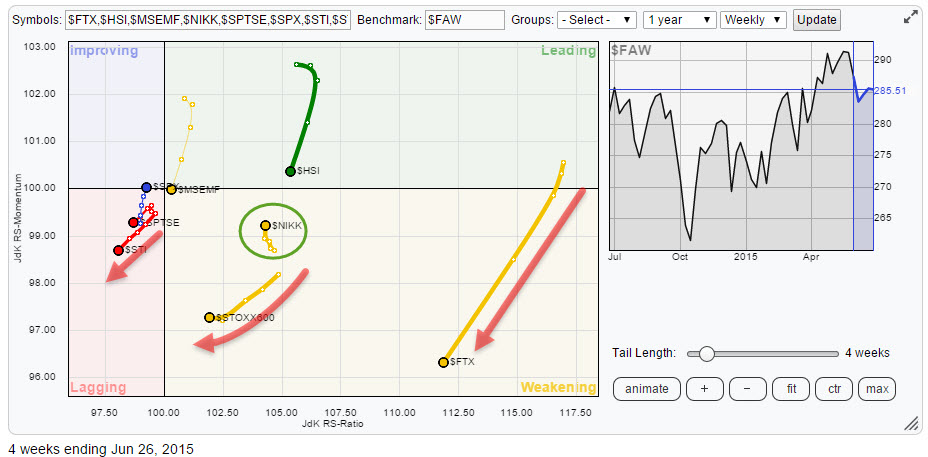
International stock markets continue to show us big rotations on the Relative Rotation Graph. The picture below holds a number of international stock market indices in comparison with the FTSE all world index ($FAW).
click the chart for the live RRG
Initial observations
Following the headline of my previous blog on international equity markets "Hong Kong on track towards all-time-high" I want to see how that market has been doing over the past few weeks and if that headline still stands. On the RRG above there is a loss of relative momentum showing up although the $HSI is still inside the leading quadrant.
Obviously China ($FTX) needs attention, the big move lower on both axes far away in the lower right hand corner (weakening quadrant) stands out. Also inside the weakening quadrant but much further to the left is the European $STOXX600 heading towards the lagging quadrant The third market inside the weakening quadrant is the Japanese $NIKK index but this one has silently turned around in the past 4-5 weeks. Compare the trail of $NIKK with that of $FTX or $HSI for example ...
Inside the lagging quadrant $STI, the Singapore Straits Times index, does not look good with an almost straight tail pointing South-West.
With these big rotations going on we need to zoom in on the RRG to see more detail of the rotations that are taking place closer to the centre of the chart.
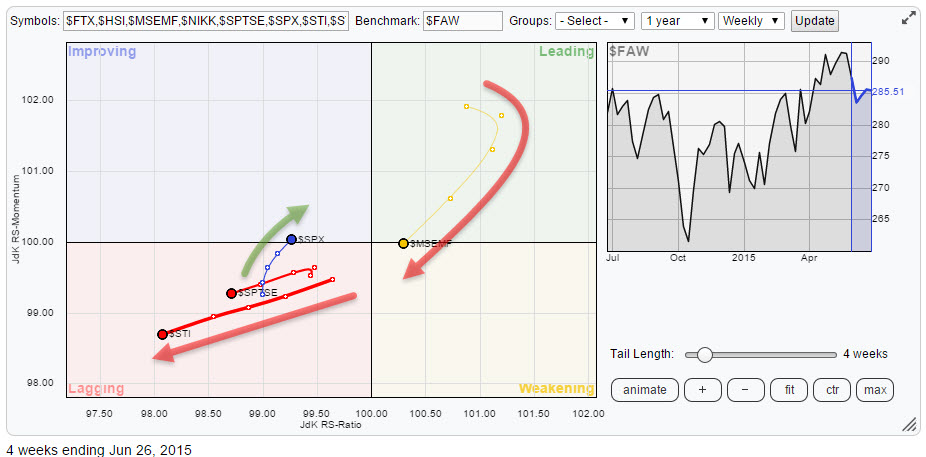
The move of the Straits Times ($STI) is magnified on this chart, leaving little doubt about the relative direction in play there. Just above the Straits Times is the Canadian S&P/TSX ($SPTSE) heading in the same direction but with a little less power behind it.
The clear opposite move that is taking place close to the middle of the chart is the S&P 500 ($SPX) picking up steam again vis-a-vis the MSCI Emerging Markets index going in the opposite direction. Be aware of the fact that the S&P 500 index makes up a big chunk of the Worldwide market capitalization which makes it difficult for $SPX to rotate far away from the benchmark. However, the opposite direction of the trails of these two markets make a very clear statement.
Hong Kong - $HSI
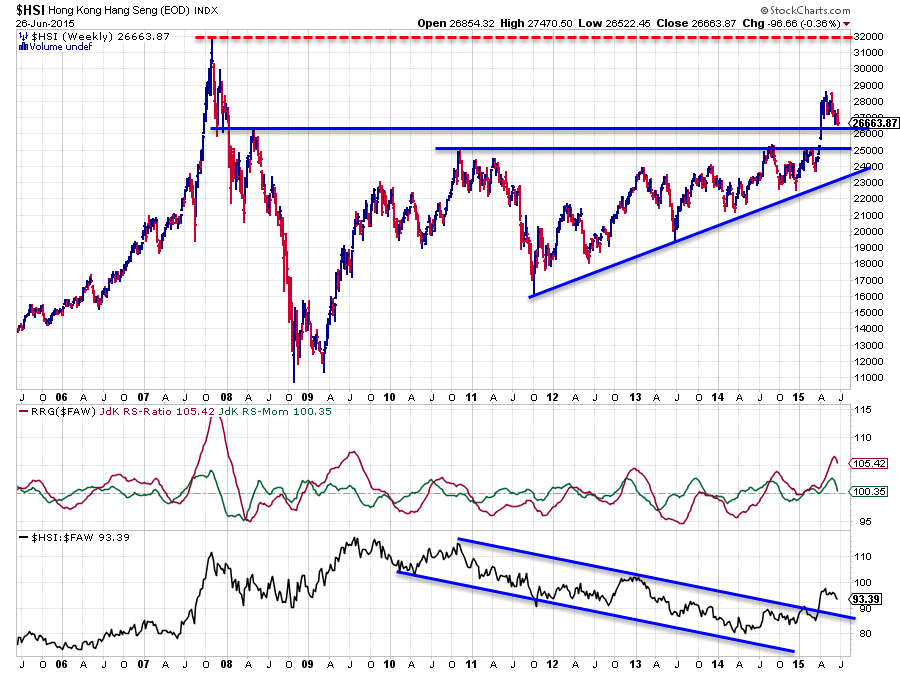
In order to follow-up and paint the picture for Hong Kong we need to revert to the long-term picture again to put things into perspective. Two levels, important levels, are showing up on the picture above. These are 25.000 which is the level of the most recent important peaks set in 2010 and 2014. The other level is near 26.000 which goes back all the way to 2007 (major low) and 2008 (major high).
This year's price action is characterized by the break of the 25.000 level while the market gapped higher and, so far, has not looked back. The price behaviour over the past few weeks is therefore, in the bigger scheme of things, corrective in nature and digesting the big move up.
This view is supported by the relative strength graphs where we can see a clear break out of a long-term falling channel on the raw-RS line while the JdK RS-Ratio is still well above the 100-level and only showing a minor loss of relative momentum at the moment. This combination should be strong enough to keep the Hong Kong market in a relative up-trend against the all world index. The only question is whether this correction will find support around the 26.000 level or if it has to go all the way back to the break-out level near 25.000 and "fill the gap". Read more about the importance of "gaps".
In the first case the market should start to show signs of a bottom forming any week now. If the gap is going to be filled the market needs another 4% more downside. In comparison to the big swings this market is going through both on the up- and the down-side that is fairly "normal". As long as the 25.000 support level holds everything still looks to be on track for a move towards the 32.000 peak!
China - $FTX
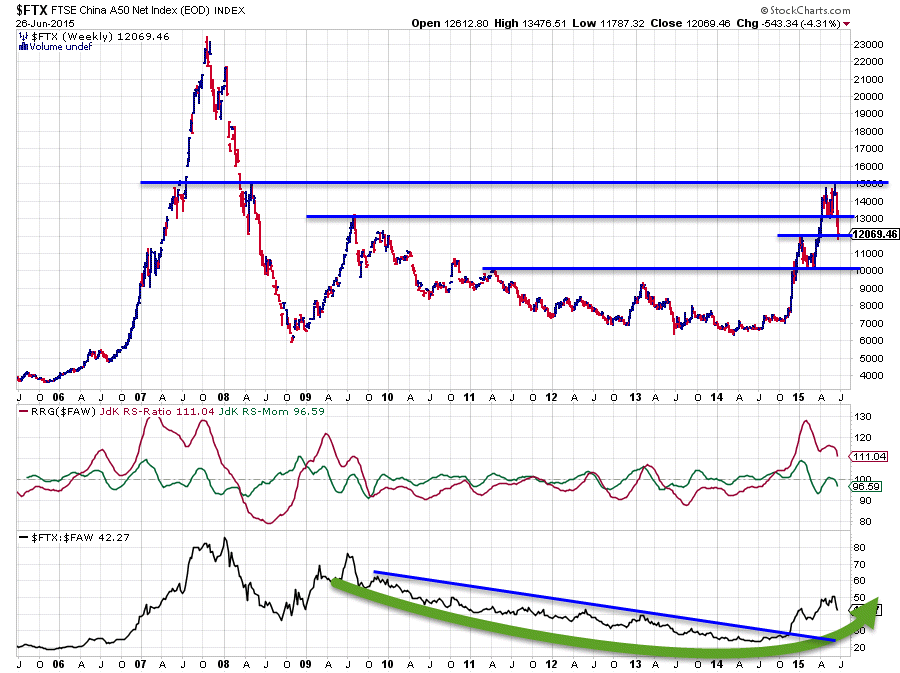
The market that is also going through huge moves and, probably for that reason, making headlines in the news, is China. Just like Hong Kong we need to revert to a long-term chart to put all this price behaviour into perspective.
It never stops to amaze me how historical market events like (major) peaks and troughs keep coming back as support or resistance levels years and years after the event. I recently saw a tweet (I think) saying something along the lines of "Markets may not have a memory but the people who trade the markets DO have a memory and therefore it pays off to look at the charts which reflect our collective memory ..." I cannot remember exactly where I saw it, let alone who said it, so I cannot give credits but I think it makes a lot of sense.
The long-term picture for China shows this phenomenon once again. The fantastic move that the Chinese market went through since the end of last year broke through a number of these long-term horizontal resistance levels like a knife through warm butter. It started with the area around 10.000 (nice round number by the way) after which a further acceleration followed putting in a high near 12.000. After that peak the 10k level was then tested as support and served as the jumping-board for a new leg higher, taking out the 12k peak as if it never happened, followed by breaking beyond the 13k peak (dating back to 2009). The next stop was roughly 15.000 which is a level that goes way back and shows up as a peak twice, first in 2007 on the way up then in 2008 on the way down.
After the initial test of this 15k level a setback brought the market back to 13k which was respected as support. After that things started to get interesting in this chart. The next attempt to break resistance around 15k failed, despite a short peak above that level, and price started to fall and very easily break the 13k level downward this time. This move completed a double top pattern which suggests the end of a move/trend. At the minimum it will cap upside potential for some time to come. A detailed view is seen in the chart below.
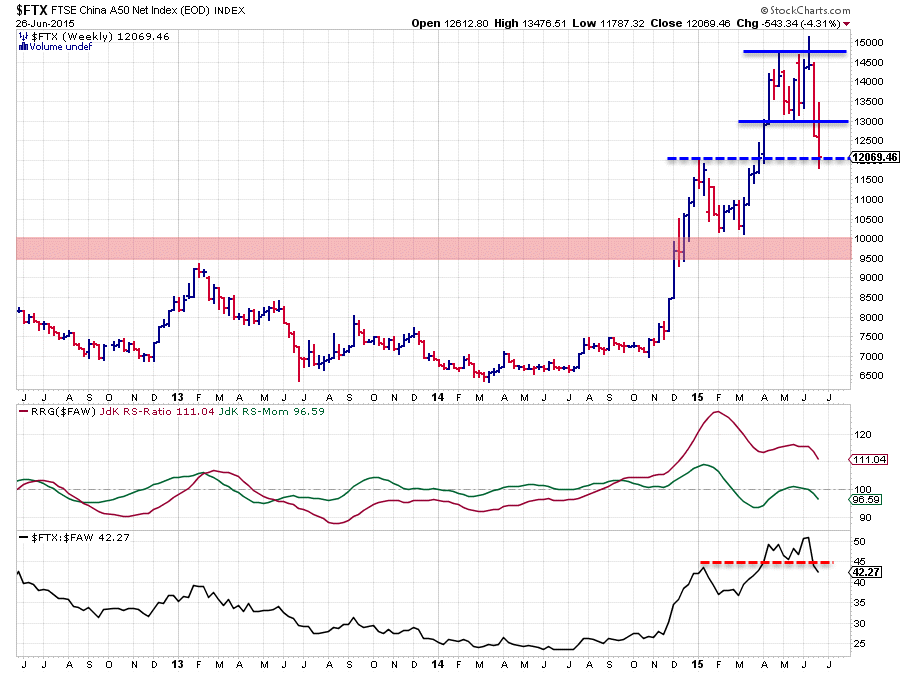
The long-term relative picture is still ok. The upward break out of the falling channel in the raw RS-line is still intact and so is the RS-Ratio line still well above 100, putting China furthest on the right of the RRG chart. For the shorter-term the peak of the RS-Momentum line against 100 and starting to move lower again is worrisome, as it suggests more downside momentum ahead. A break below support at 12.000 will very likely be the catalyst for a move back to the 10.000 area, which would be significant and something that will surely hurt the relative trend.
All in all it looks like China is in for a more serious correction of the previous up-move, and although a very long-term change of trend in favour of the Chinese market seems to be under way, the risk is increasing now and one will need a really strong stomach, or deep pockets for that matter, to ignore recent price behaviour.
Japan - $NIKK
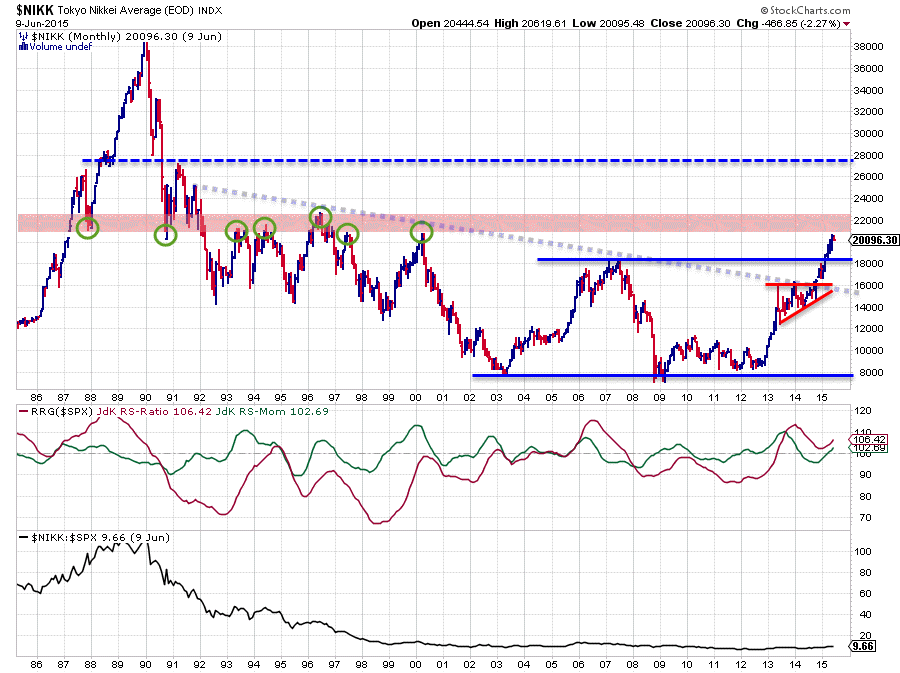
The third long-term picture is for the Japanese market represented by the Nikkei index ($NIKK). Watch out! This is a monthly picture so the RRG lines are measuring really long-term relative trends, we're talking multi-year here. For the benchmark I have used the $SPX index, as the $FAW, which I usually use in my graphs for international equities, does not have enough history (only starts in 2004). Once again we see the power of long-term charts and levels coming into play.
For the record this type of constellation of the RRG-Lines would put the Nikkei index comfortably inside the leading quadrant heading higher on both axes, suggesting a continuation of the positive relative trend.
Back to the chart above, once again, we see some important horizontal levels in play. Starting at the bottom we find the major support level around 8.000 which was first set in 2003 and then tested in 2008/9 and again in the period 2011-2013 while the Nikkei started hammering out a long-term reversal. During the consolidation in 2013-2014 the Nikkei formed a nice ascending triangle pattern and the upward break out of that pattern, coinciding with the break above the long-term falling resistance, line kicked off the rally in which the market now is still moving higher. During this rally the major resistance level (~18.000) that was set by the peaks in 2006 and 2007 was taken out fairly easily and added new fuel to the move.
The break above that 18.000 area pushed the Nikkei to a 15-year high and it also ended the series of (major) lower highs and lower lows on that monthly chart. Such events should not be taken lightly. Having said that; where are we now?
The big red banner on the chart above basically says enough. The Japanese market is approaching an important area of "market-memory". The zone around 22.000 has proven to be of importance many times in the past and unless proven differently we have to assume that it will start to do that again. Either by breaking right through it and continuing its rally which is possible but seems somewhat unlikely given the steep rise we have already seen, or by slowing the pace of the current rally and maybe setting a temporary high or a small corrective move. All in all it will very likely be price action within a longer-term up-move which will likely push the Nikkei much higher in the months to come. Based on the 8.000 - 18.000 "range" prior to the break a target can be pegged in the 28.000 area which is close to peaks seen in 1987 and 1991.
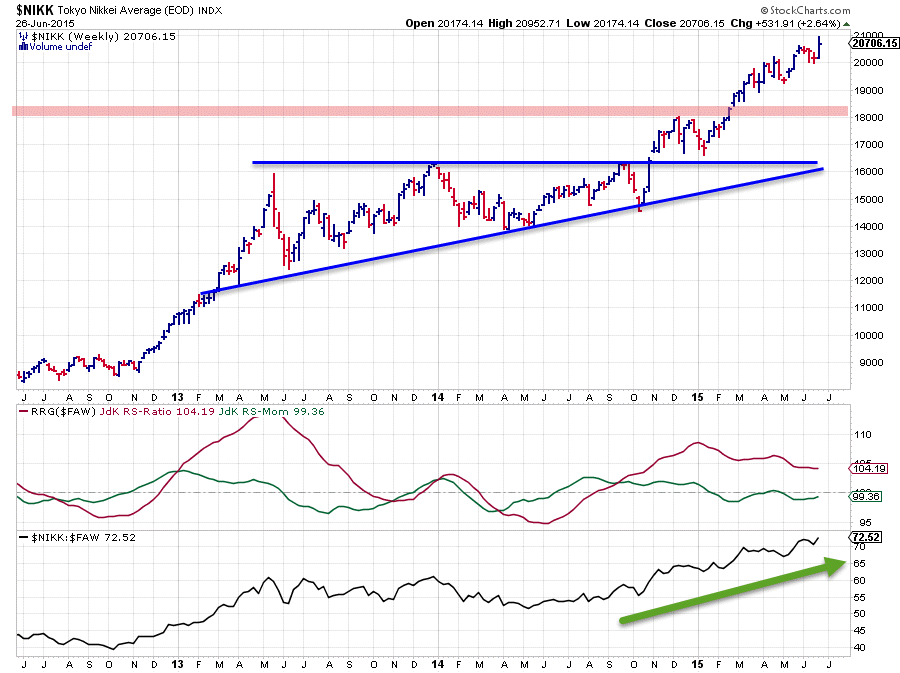
The chart above shows the recent power of this market in more detail as well as the fact that last week's close once again pushed above a prior high. Also the relative strength line (lower pane) is still in a clear up-trend while the RS-Ratio line is camping comfortably above 100. The only slight negative is the RS-Momentum below 100, albeit only marginally and seems to be turning up again. All in all a very strong picture with still some 1.200 points or roughly 5% of upside potential until the 22.000 resistance zone will be tested and we can see if that is strong enough to cause a setback, If so, 18.000 would be the perfect pull-back level and this will most likely cause a renewed entry opportunity.
Conclusion
- Some big rotations are going on and at the moment they seem concentrated in Asian markets.
- (very) Long-term charts are needed to put things in proper perspective.
- China looks to be rotating out of favour at least for a few months.
- Hong Kong is still on track to its all-time-high level despite setback (new buying opportunity?)
- Japan continues strong move higher! Watch for resistance in 22.000 area (5% up from current levels)
If there is one thing these charts tell us then that would be: "If you can't stand the heat, get out of the (Asian) kitchen!".... But if you can, there may be some yummy returns for dinner!
Although I am using indices for my analysis here there are plenty of ETFs available to put any view into something actionable!
Julius de Kempenaer | RRG Research
RRG, Relative Rotation Graphs, JdK RS-Ratio and JdK RS_Momentum are registered TradeMarks by RRG Research


