Over the past few weeks, I have argued in some my posts that the state of sector rotation would not back a strong rise for the general market. The "defensive" sectors were simply too strong compared to the, more, cyclical sectors which are usually needed to push a market higher.
At the moment, I still believe this argument holds up although technology, one of the sectors that we need for a broader push higher, seems to be picking up again, at least the tech stocks that are in the Dow Jones Industrials index.
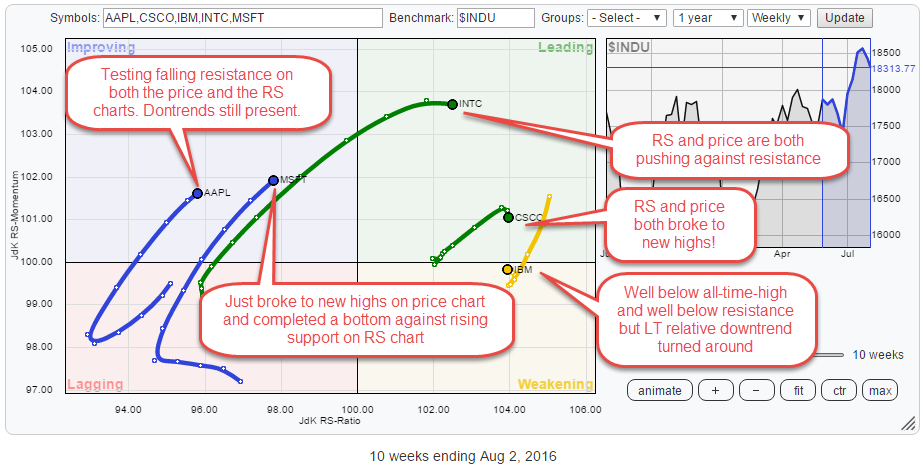
The Relative Rotation Graph below holds the components of $INDU and shows improvement for the tech stocks but less so for financials, which is another sector that usually needs to do well in for an uptrend in SPY to materialize. 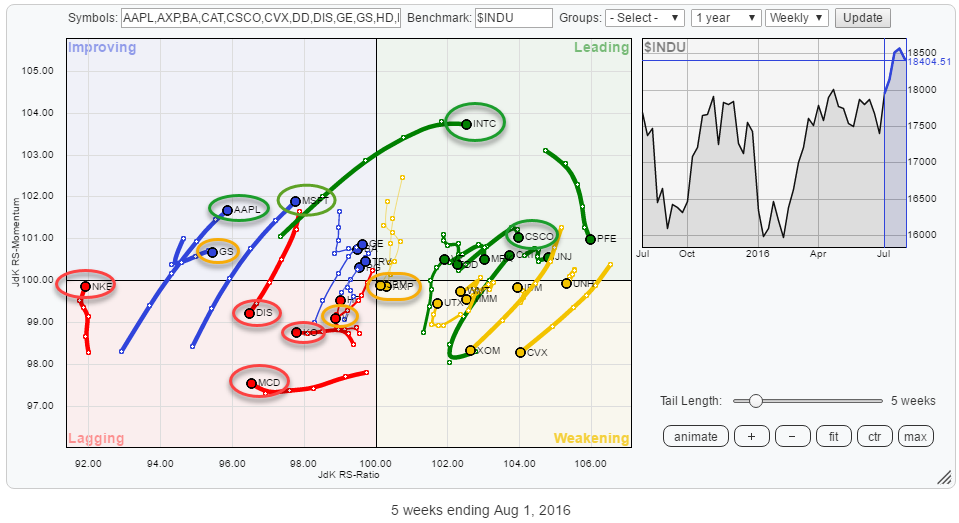
Summary
- Continuation of relative downtrend expected for DIS
- A break below support at $ 43 in KO will add fuel to the relative downtrend that is already underway
- Two double tops (price and RS) in MCD, indicate risk ahead
- Technology clearly beating Financials keeping broader market outlook mixed
- GS ready to rotate back into the lagging quadrant
- V rotating into lagging quadrant despite potentially bullish price chart
- MSFT is coming from extreme low reading on JdK RS-Ratio, worth keeping an eye on.
- Break to new highs in RS (and price) for CSCO expected to push relative trend higher
Although technology stocks are improving, it's the weakness of the financials sector that keeps sending mixed sector rotation signals preventing broader market indices like $INDU and $SPX to rally as expected after their breakouts.
Quick scan
A quick scan of the RRG above shows the tech stocks in the green ovals. Especially INTC and CSCO look strong as they are already in the leading quadrant and till moving deeper into it while rising on both axes. Inside the improving quadrant, AAPL and MSFT are showing long (=strong) tails, but the rise is predominantly on the JdK RS-Momentum axis and less on the JdK RS-Ratio axis, which is the measure of the trend in relative strength.
The financial stocks are marked inside the orange ovals. All of them went through a more or less positive rotation over the past few weeks (scroll back and forth on the live version of the chart above). JPM, AXP, and V have already started to rotate backward, into or almost into the lagging quadrant again. GS is still inside improving but too far left (too low on the RS-Ratio scale) to make it interesting from a relative point of view.
I have marked a few stocks in red ovals as they are the ones to avoid at the moment. NKE is, despite the recent rise on the RS-Momentum axis, the weakest stock inside $INDU. DIS, KO, and MCD are rapidly weakening and expected to underperform the benchmark in coming weeks.
Where to stay away
Walt Disney Co. - DIS
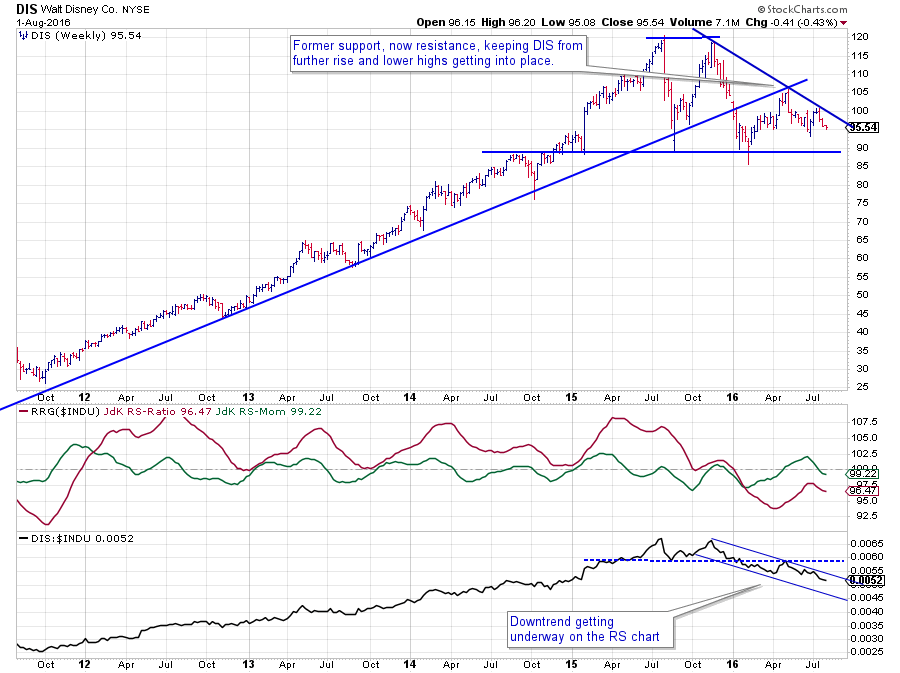 For some years, DIS has been one of the absolute stars of the Dow, but that started to change in the second half of 2015.
On the price chart a big double top was formed with two peaks at $ 120 and a, in between, low at $ 90 but the pattern never completed and triggered the "sell signal" by breaking below $ 90, yet. The rally out of the $ 90 low failed against the previous rising support line, now acting as resistance. And lower highs are now getting into place on the price chart.
A break below the support zone near $ 90 will very likely cause an acceleration lower.
On the relative charts, the picture changed at the beginning of 2016 when the RS-Line broke below its former low and completed the double top that was set in the second half of 2015. The recovery in relative strength pulled back towards the breakout level but put in a new high there and started to decline again, recently confirming the downtrend by breaking to new lows.
The clear downtrend in place on the RS-chart positions DIS well inside the lagging quadrant, after a brief rotation through improving. A continuation of this weak rotation may be expected in coming weeks.
Coca-Cola Co. - KO
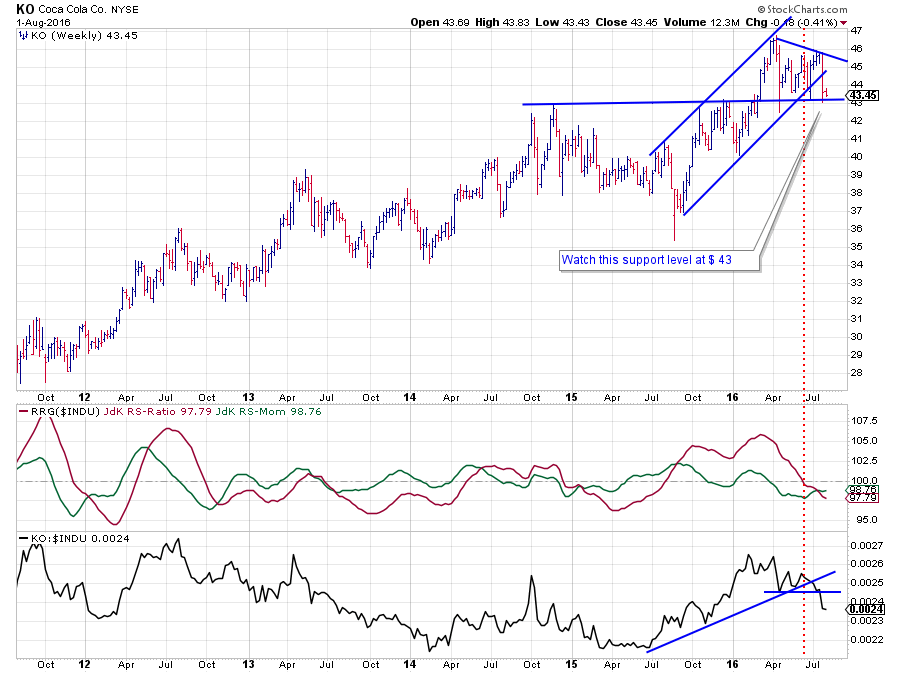 KO went through a nice upward rotation that was picked up by the JdK RS-Ratio line in July 2015. After breaking to new highs, above $ 43, on the price chart, the initial rally took the stock to a new peak around $ 47 but then momentum started to fail.
Since setting that high, the pull-backs have all been caught at the former breakout level which is now apparently acting as support. However, the question is how much longer this support will be strong enough. Recently a clear new, lower, high has been put in place while, at the same time, breaking below the rising support line.
The RRG-Lines have already crossed below 100, putting KO inside the lagging quadrant and the RS-Line already broke its support line as well as its previous low. These are enough ingredients to question any potential for outperformance in the weeks to come while downside risk continues to increase.
McDonalds Corp - MCD
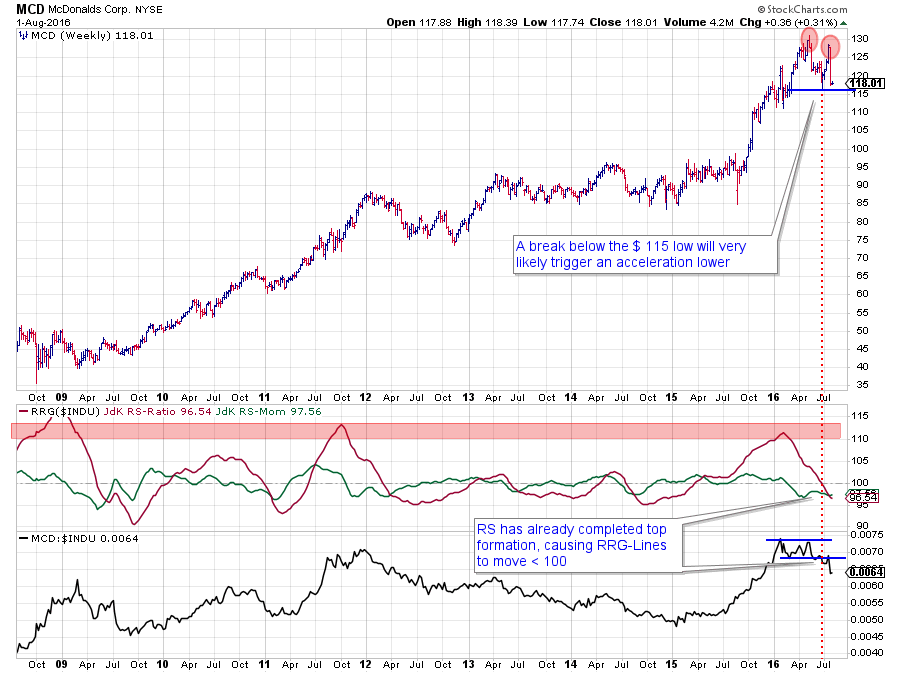 MCD is on the verge of completing a major top formation. The last rally failed short of the previous high near $ 130, and a distinct lower high has been put in place by a very nasty long weekly bar pointing lower. The low at $ 115 will now be a crucial level to watch. When this support gets broken, there is only a minor support level around $ 110 left before the next serious support level, which only comes in, around $ 100.
From a relative perspective, things do not look much better. The JdK RS-Ratio line followed the RS-Momentum line lower and below 100 a few weeks ago, positioning MCD well inside the lagging quadrant on the Relative Rotation Graph.
The completed double top followed by an acceleration in the decline of the RS-Line indicates that more negative rotation may be expected in coming weeks.
Technology vs. Financials
 From a sector rotation point of view, technology and financials are two interesting, and important sectors to keep an eye on. Based on the sector rotation model (by Sam Stovall) one would expect these two sectors to move close to each other with financials leading technology through the recession phases (early and full) of an economic cycle through bear market into a market bottom. But that is not happening....
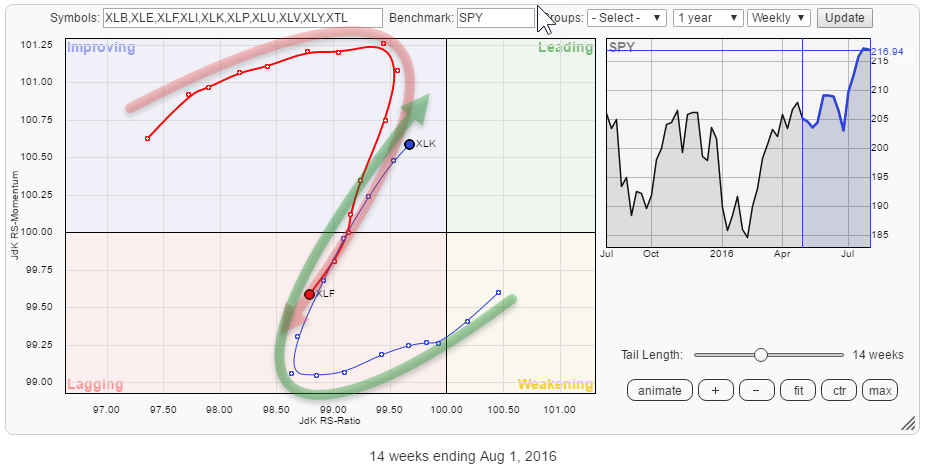
"Au contraire"... Both sectors have been, and still are, in a relative downtrend against SPY but the rotation of the technology sector is now rapidly moving through the improving quadrant and heading towards leading, while financials are almost rotating exactly opposite.
It's this situation, and especially the relative weakness of the financial sector which makes me cautious towards a broad market rally.
Financials
Goldman Sachs Group Inc. - GS
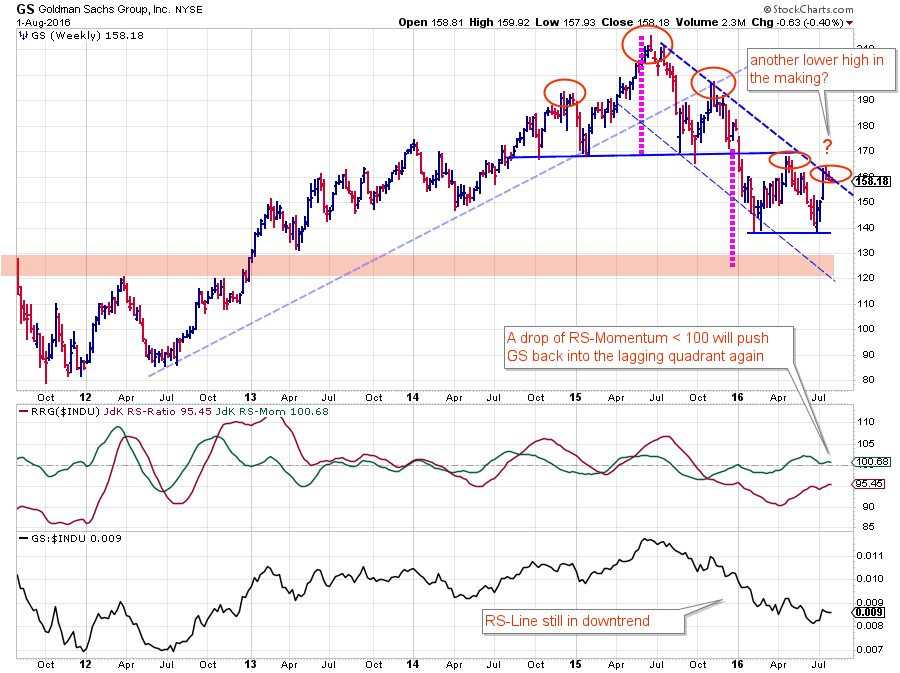 GS seems to be setting a new, lower, high against the falling resistance line that marks the top of the declining channel. Goldman completed a Head & Shoulders top formation in the early days of 2016 and dropped to levels near $ 140 where it found support. The rally peaked against the neckline, and the support are around $ 140 was tested again.
The most recent rally now seems to fail against the falling resistance line which is another sign of weakness. As long as price remains within the boundaries of the channel, the downtrend remains intact.
On the relative charts, the raw RS-Line continues to show a rhythm of lower highs followed by lower lows which means that the downtrend is fully intact here as well. The levels of both RRG-Lines position GS inside the improving quadrant on the Relative Rotation Graph.
With RS-Momentum only just above the 100 level, the next move down on the RS-Line will push GS back into the lagging quadrant and start a new leg down in the current relative downtrend.
Visa Inc. - V
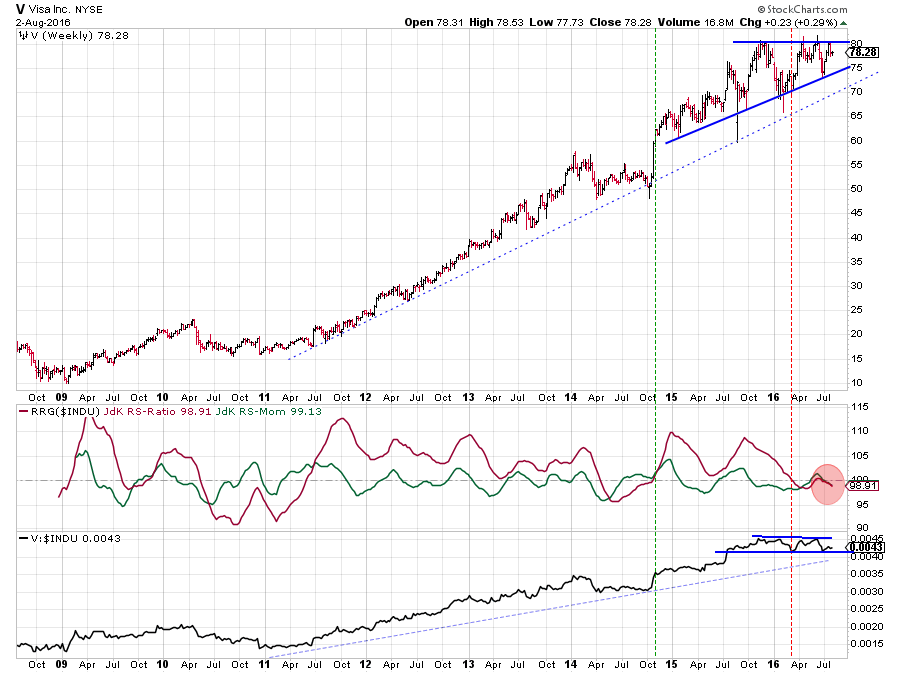
The most recent uptrend in the relative strength of Visa against $INDU started at the end of 2015 and lasted until the beginning of March when the JdK RS-Ratio line, measuring trends in relative strength, dropped below 100. The raw RS-Line started to move between the boundaries of a tight range and is still captured inside this sideways pattern.
The recent oscillation of the RRG-Lines caused a very quick rotation of V on the Relative Rotation Graph and with both lines below 100, the stock is now located inside the lagging quadrant and heading deeper into it. This suggests a continuation of the relative downtrend in coming weeks with the only caveat being that the RRG-levels are still very close to the benchmark which means that there is not much power/momentum behind this relative move yet.
The picture on the price chart is a bit different with a horizontal resistance level showing up around $ 80, tested four times since October last year, and a number of higher lows guiding price higher. The higher lows suggest that buyers are willing to pay a higher price on each corrective move but so far have not been strong enough to break the $ 80 resistance level. Such a break will very likely result in an acceleration, taking V up to higher price levels.
The strength of such a move will dictate the impact on the relative strength of Visa against $INDU.
For the time being, more relative weakness is expected but I am keeping an eye on a potential break of price above $ 80.
Technology
There are five technology stocks in the Dow Jones Industrials index, AAPL, MSFT, INTC, IBM, and CSCO. And they are showing very different relative rotations and price charts.
From the stocks on the RRG above I have picked MSFT and CSCO for further inspection.
Microsoft Corp. - MS
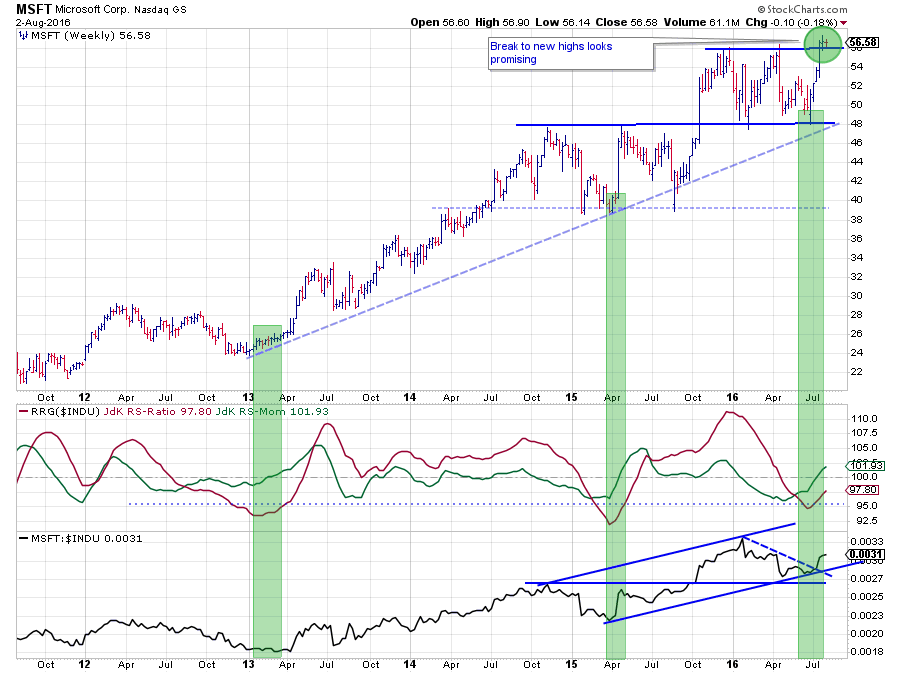 The uptrend in relative strength for MSFT versus $INDU was picked up by the RS-Ratio line in June last year and the break to new highs in the RS-line accelerated this uptrend. During the first half of 2016, MSFT moved in a sideways range, causing relative strength to drop and push the stock through a negative rotation.
Over the past three weeks, things have started to change. On the price chart MSFT broke above horizontal resistance and so far has managed to hold up above that breakout level. But just like the S&P 500, the break was not followed, yet, by an acceleration higher, as one would expect.
The move in price did improve things from a relative perspective as well. On the RS-Line a low has been put into place against the rising support line, and this marks the end of a corrective move within a longer-term uptrend.
The interesting part of the chart above is when we look at the oscillations of the RRG-Lines and especially the JdK RS-Ratio line. The green shaded areas indicate where the RS-Ratio has bottomed over the past few years at "low" levels, i.e. deep inside the lagging quadrant. Out of these extreme lows in the RS-Ratio line, powerful moves in relative strength often emerge.
With price breaking to new highs, this is at least a stock to keep an eye on!
Cisco Systems Inc. - CSCO
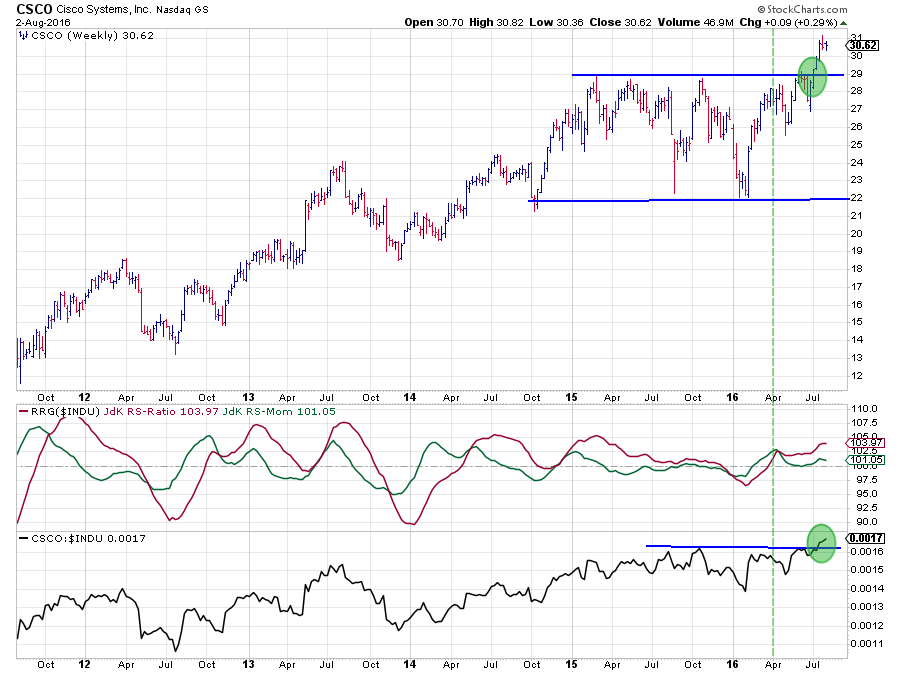 Together with IBM, CSCO is the tech stock with the highest RS-Ratio value and positioned well inside the leading quadrant. What sets CSCO apart from the other tech stocks in the Dow is the fact that it broke to new highs on both its price- as well as its relative strength chart. Also, the break on the price chart looks convincing, the break above $ 29 resistance was followed by a quick rally towards $ 31 clearing the breakout area and thus mitigating the possibility of a "false break."
The former resistance level near $ 29 may now be expected to act as firm support below any corrective move back in coming weeks, a buying opportunity.
The RS-Line of CSCO is also well above its previous peak and should be able to gain further in coming weeks, supporting a further uptrend in relative strength.
Julius de Kempenaer | RRG Research
RRG, Relative Rotation Graphs, JdK RS-Ratio and JdK RS-Momentum are registered TradeMarks by RRG Research
Follow RRG Research on social media:
