 After the dust has settled, it is time to assess what is going on under the hood.
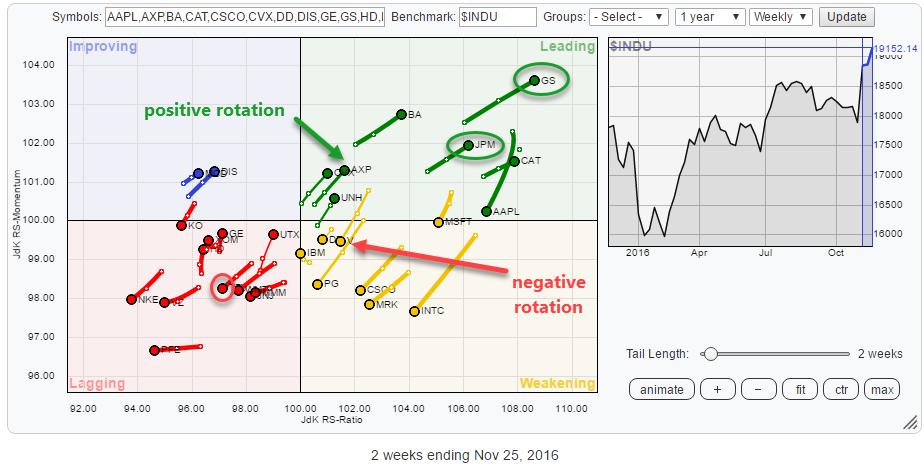
The above Relative Rotation Graph holds the 30 Dow Jones Industrials components. As usual, they are fairly evenly spread out over the canvas of the RRG plot.
From the RRG of the US sector ETFs (further down in this post), it is very clear that the Financial sector is leading at the moment. In this post, I want to dissect some of the individual financial components inside the Dow Jones Industrials index. Spoiler alert: They are not all equally good ....
Summary
- Financials are leading, but not all are equally good
- TRV is the weakest financial stock inside $INDU, expect further underperformance
- Limited upside left for V with downside risk increasing
- GS is the strongest stock but needs to take a break as it is running into resistance
- JPM is just behind GS in terms of relative strength and close to resistance
- AXP just turning around and inside the leading quadrant with good risk/reward ratio
From a sector perspective
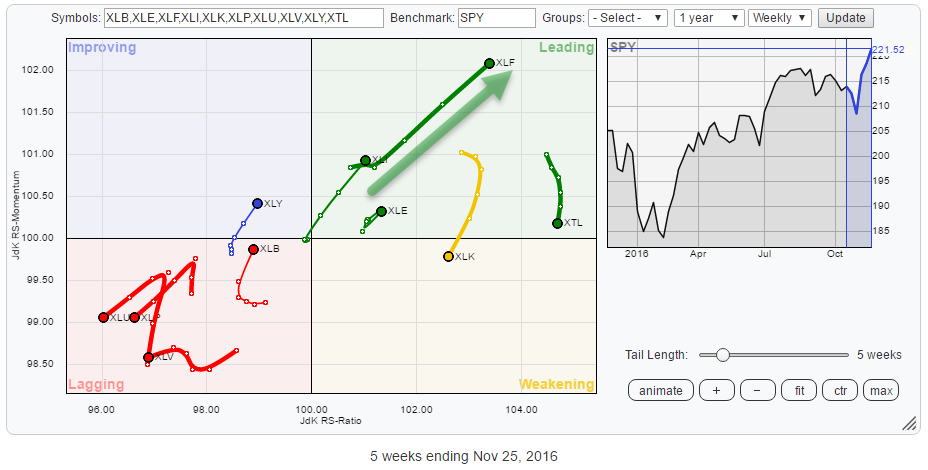 On the RRG holding the US sector ETFs, it shows very clearly where the relative strength of the market lies at the moment. XLF, Financials, is shooting further into the leading quadrant at an almost 45-degree angle backed by strong moves from week to week creating one of the longest and strongest tails in this universe.
Financials are followed by Industrials and Energy and to a lesser extend Consumer Discretionary. The relative strength of the Technology is rotating lower at the moment, into the weakening quadrant. Based on the reading of the JdK RS-Ratio it is still the third strongest sector in the S&P 500, so we should monitor its rotation and potentially look for a rotation back-up while inside the weakening quadrant and get on board again.
For the time being, Financials are the place to be. But which one(s)?
Inside Financials
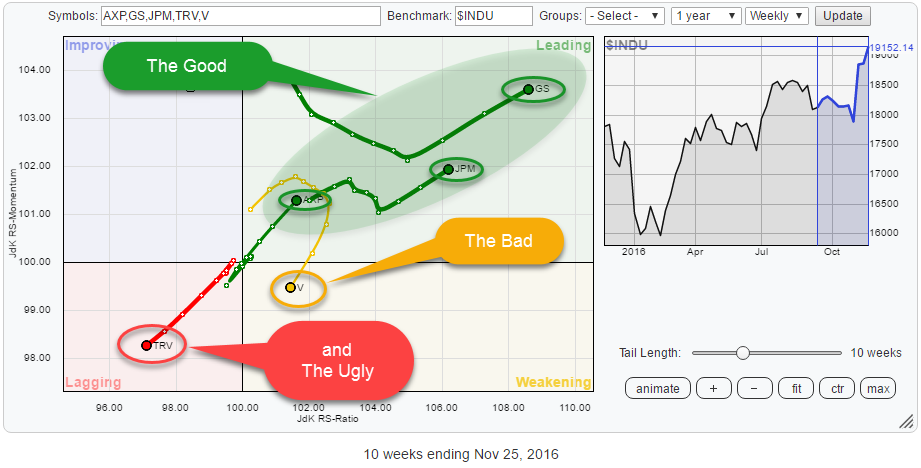 On the RRG above I have singled out the five financial stocks within the DJ Industrials Index ($INDU).
Three of them, GS, JPM, and AXP are inside the leading quadrant and pushing higher on both axes, causing a positive heading.
There is one, TRV, (deep) inside the lagging quadrant and pushing lower (on both axes). And one, V, is inside the weakening quadrant and rotating towards the lagging quadrant.
The Travelers Cos., Inc - TRV
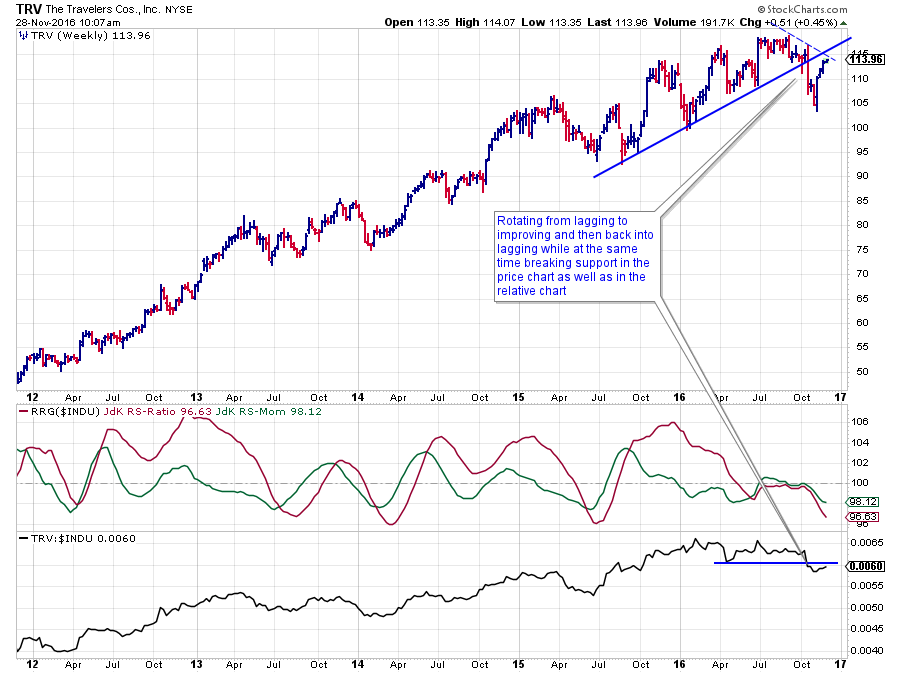 When TRV rotated into the lagging quadrant (both RRG-Lines below 100) back in April-May, the price was still above its rising support line.
Following the rotation into the lagging quadrant, the raw RS-Line started to move sideways, causing JdK RS-Ratio and JdK RS-Momentum to gain a little again bringing RS-Momentum back above 100, albeit slightly, while RS-Ratio paused just below 100.
The break of the rising support line on the price chart was the catalyst for the drop below support on the relative strength chart as well, pulling both RRG-Lines back below 100 again, pushing TRV into the lagging quadrant. This time the move got backed by more negative momentum pushing the stock firmly into the lagging area.
The recent rally in price is stalling near the old support line which will now act as resistance as well as the newly emerging falling resistance line which connects the recent highs. It looks like there is not much upside left on the price chart nor the RS-chart.
This rotational behavior makes TRV the weakest financial stock within the Dow Jones Industrials index at the moment.
Visa Inc. - V
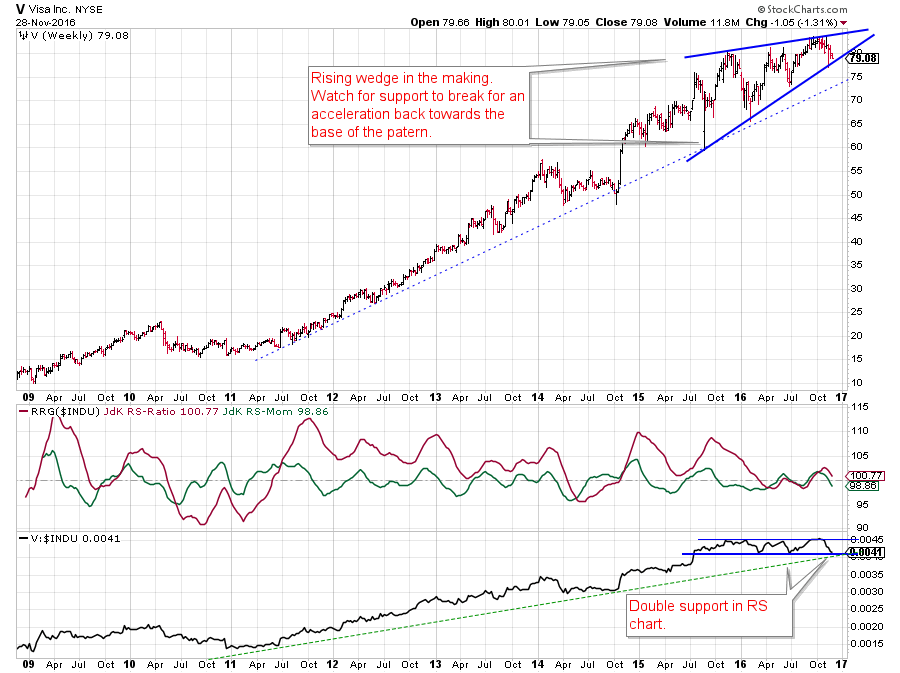 The most recent relative rally for V took the RS line from the lower boundary of its trading range to the upper boundary and at the end of the day did not much good to the bottom line.
A few weeks ago it looked as if Visa was on its way to start another up-leg in relative strength when the RS-Line attempted to break above the resistance of its trading range while both RRG-Lines had already crossed above 100 and price rallied to a new high. It did not work out.
The new high was set only marginally higher before dropping back below its previous resistance level. Resistance in relative strength was too strong and pushed the relative line to the lower boundary of its range. This caused the JdK RS-Momentum line to drop back below 100 already, and RS-Ratio is on its way.
This means that the more positive scenario for V is now off the table and there is, potentially, a turnaround into a negative (relative) trend in the making.
The formation that is unfolding on the price chart seems to develop as a rising wedge which, when broken, downward is a trend-ending pattern calling for a decline towards the base of the pattern. In this case the region between $ 60 - 65.
The RS-Line is hovering above double support coming from the horizontal level that marks the lower boundary of the trading range and the rising support line that connects the major relative lows since early 2011.
All in all, there seems to be limited (relative) upside left for V while downside risk is increasing.
The leading quadrant
The heavyweight, big names, are found in the leading quadrant, and they are still pushing deeper into it. These are GS, JPM and AXP from high to low on the JdK RS-Ratio axis. This means that GS has the most mature relative trend of the three while AXP probably has the most potential.
Goldman Sachs Group, Inc. - GS 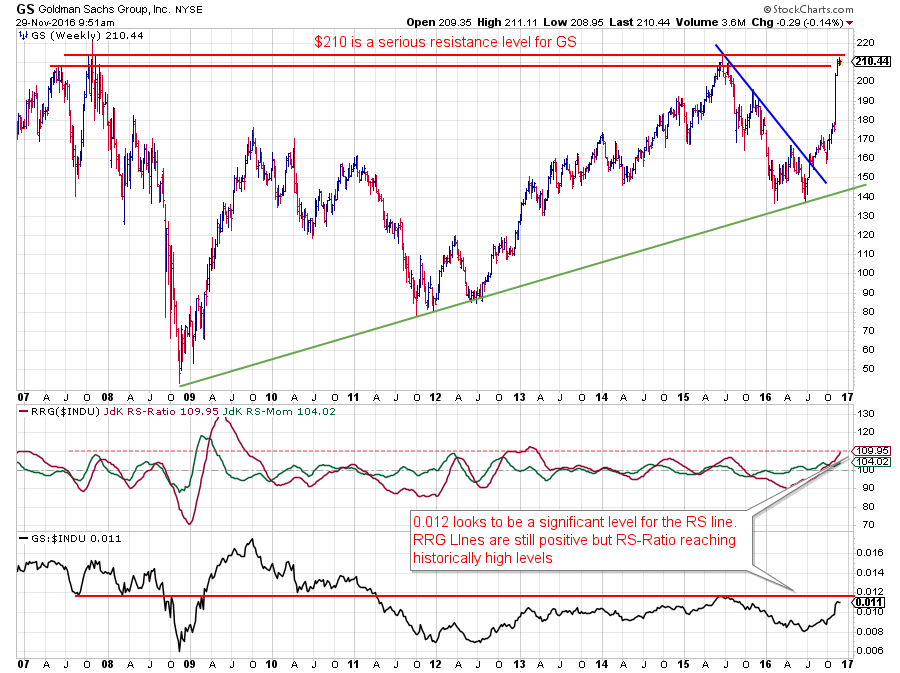
After jumping from $ 170 to $ 210 the price increase of GS seems to be stalling now.
I had to revert to a longer-term chart to see that the region around current levels ($ 210) is actually an important resistance level that dates back to the pre-2008 all-time-high which was tested as resistance in June 2015.
There is no doubt that a break beyond this important resistance barrier will be very important and very likely will unlock a lot of new upside potential. But.... it still has to happen.
From a relative point of view the 0.012 level on the raw RS-chart seems to be a significant level that has been tested as both support and resistance a few times before. At this point in time resistance is expected around it and a break higher would be a positive.
Combining the raw RS reading with the levels of the RRG-Lines makes me cautious as the JdK RS-Ratio line is reaching levels that can be judged as "high" from a historical comparison. Only in the first half of 2009 the JdK RS-Ratio line of GS vs $SPX managed to move significantly beyond the 110 area.
All in all, it seems that GS needs to take a break from current levels. A rotation towards the weakening quadrant is likely. The rotation inside the weakening quadrant will then become important to get a handle on the follow through.
J.P. Morgan Chase & Co. - JPM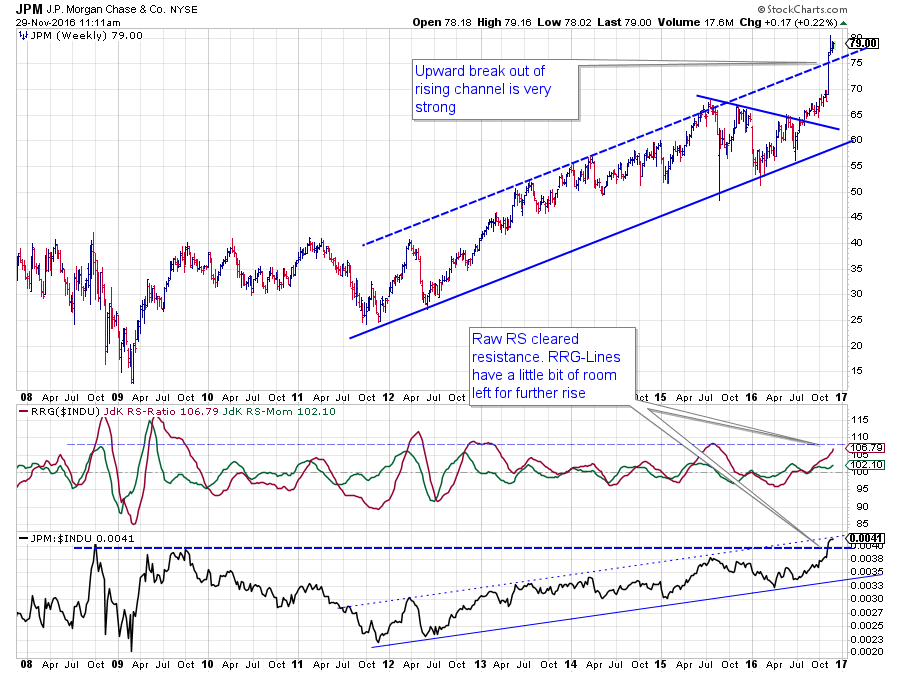
J.P. Morgan already broke to new highs in the early days of 2013 and has kept a steady pace ever since. From mid-2015 to mid-2016 the stock consolidated in a big symmetrical triangle but eventually broke out to the upside. Shortly thereafter JPM managed to break above its old peak and finally also, just recently, pushed above the upper boundary of the rising channel.
All very strong and positive events.
The raw RS chart shows a gradual uptrend since the beginning of 2012 which results in an RS-Ratio line that predominantly moved above 100 with a few setback below 100, causing some quick rotations on the Relative Rotation Graph.
Last month's relative rally and break to new highs has pushed the RS-Ratio line to levels which, historically seen, can be judged as "high." A similar situation as we have seen with GS above. JPM seems to have a little bit more upside available.
This lower reading on the RS-Ratio scale makes JPM a slightly more interesting stock than GS at the moment.
American Express Co. - AXP
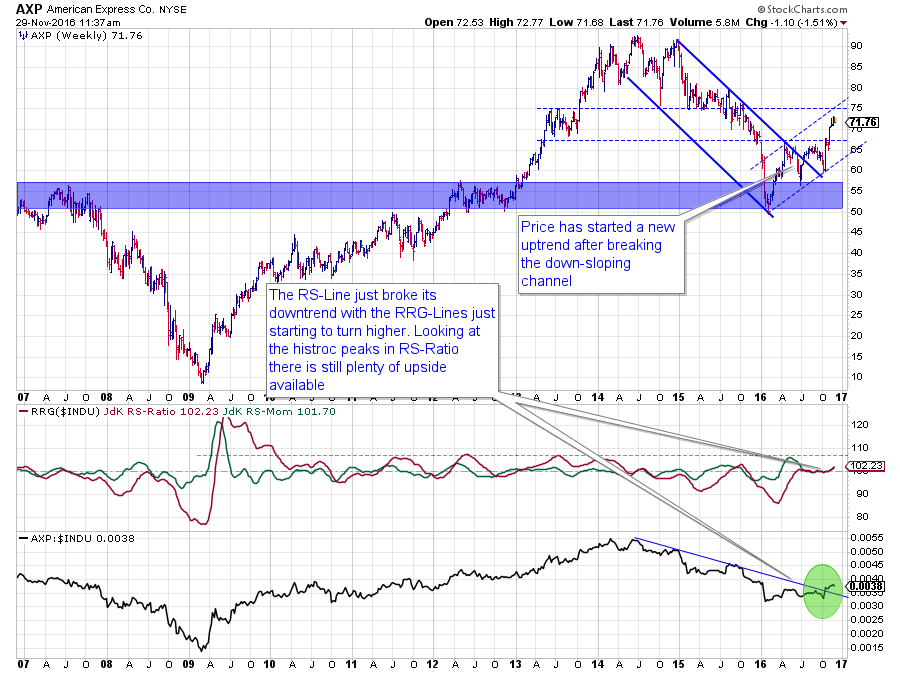 The last and the best financial stock, for the moment, within the DJ Industrials Index is American Express.
On the price chart, AXP left the falling channel in June-July of this year and, after a consolidation period, started a new series of higher highs and higher lows. At the moment AXP is pushing towards the next resistance level on the chart near $ 75.
This turnaround in price is already pretty positive in itself, but the good news comes from the relative charts where AXP has only just broken the falling resistance line, clearing the path for further relative upside.
As this move is in its early stages, both RRG-Lines are only just starting to move away from the 100-level, and as you can see on the chart, there is plenty of upside potential available before the JdK RS-Ratio line hits historically high levels.
Financials are doing well inside the DJ Industrials index and out of the five financial names in $INDU, AXP seems to be the one with the best risk/reward ratio for now.
Julius de Kempenaer | RRG Research
RRG, Relative Rotation Graphs, JdK RS-Ratio and JdK RS-Momentum are registered TradeMarks by RRG Research
Follow RRG Research on social media:


