 Yesterday, Thursday 19th of April, it was my turn again to join Tom and Erin in their Market Watchers Live show again. By the way, I will be joining them every third Thursday of the month to talk about RRG and talk about market developments from an RRG point of view.
My idea for yesterday's show was to talk the audience through some of the rationales behind my most recent article on the rotations inside the Dow Jones Industrials index.
While I was reading through the article again and watching the updated Relative Rotation Graphs for the Dow my eye caught another pair of stocks worth keeping an eye on and one single stock that is showing a very promising rotational pattern.
Summary
- BA and GE showing opposite relative momentum moves
- CAT turning back to leading quadrant
GE vs BA
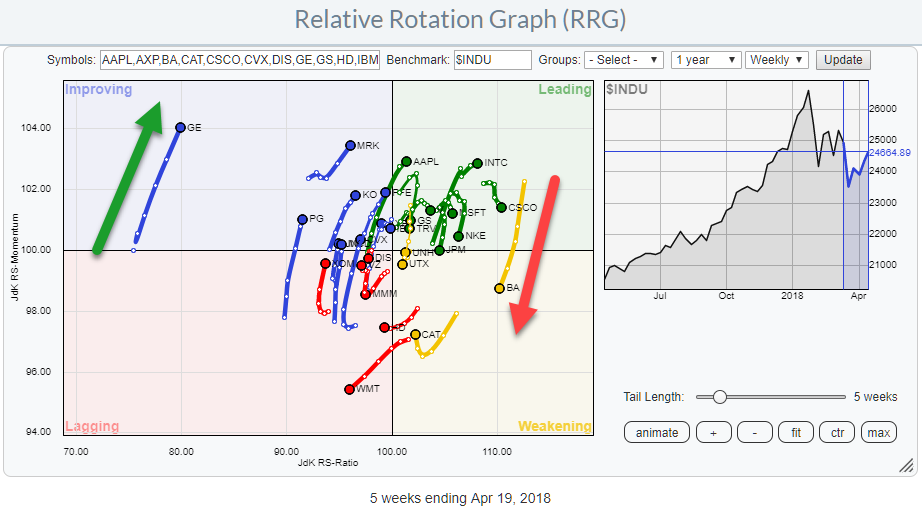
 The Relative Rotation Graph at the top of the article shows the rotation for all members of the DJ Industrials index.
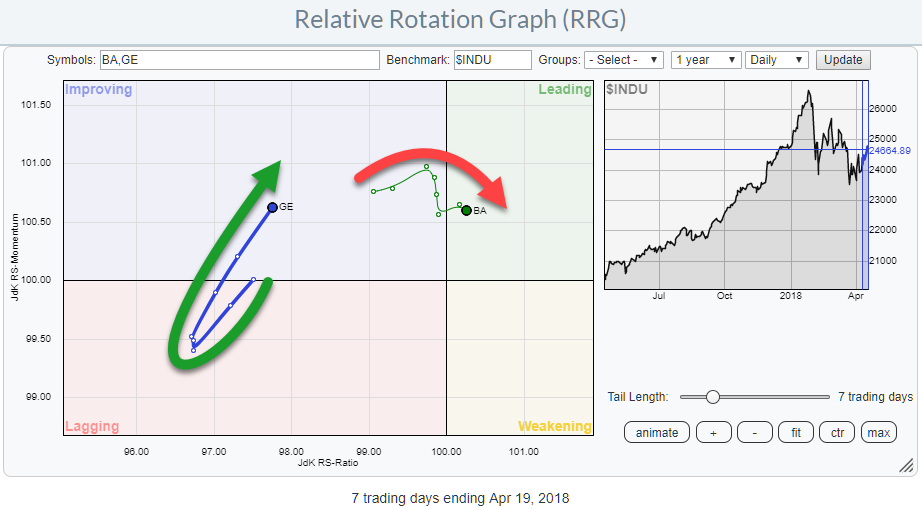
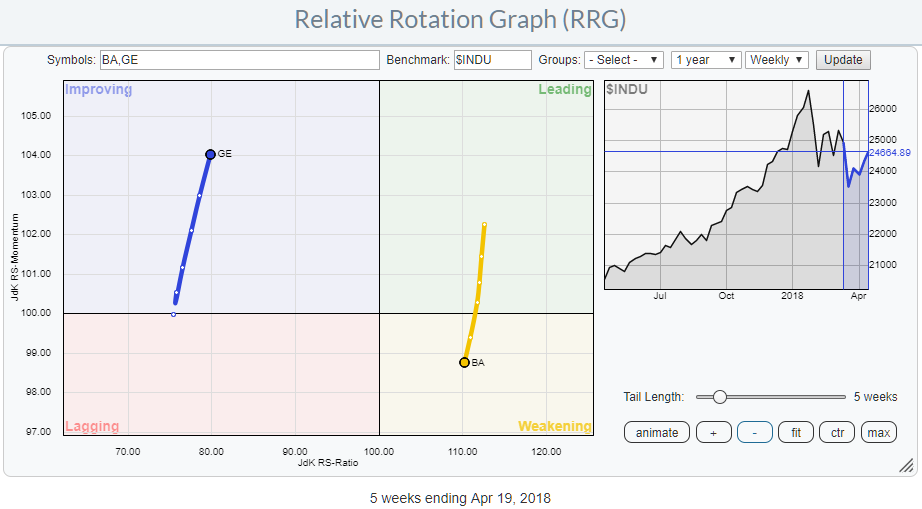
Two tails that stand out here are the ones on both extremes of the JdK RS-Ratio scale. On the right-hand side of the graph at the highest reading on the JdK RS-ratio scale (shared with CSCO), we find BA while at the left-hand side of the RRG we find GE, more or less isolated, at the lowest RS-Ratio reading but pointing almost straight up AND at the highest JdK RS-Momentum level. The RRG image above shows those two tails in isolation.
The daily version of this RRG shows BA just crossing over into the leading quadrant but losing relative momentum over the past 5-6 days, pointing the tail towards the weakening quadrant.
GE, on the other hand, is inside the improving quadrant and rapidly picking up relative momentum causing a positive RRG-Heading.
This rotation seems to have some room to continue but be careful as it is a pretty aggressive approach only aiming to capture a bit of the contra-trend move on both sides.
Boeing - BA
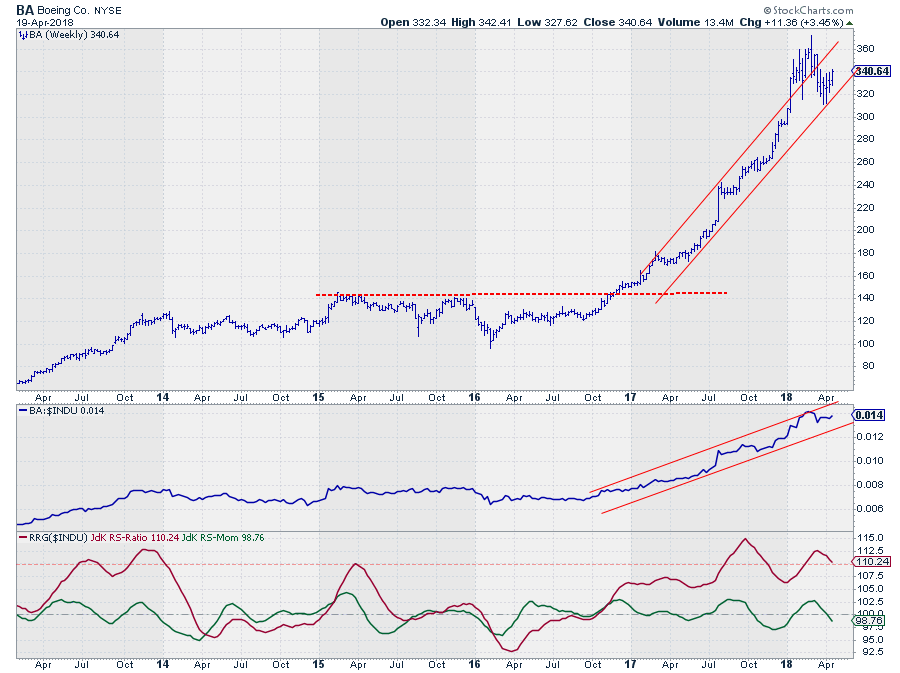
On the weekly chart, BA is still captured within the boundaries of the channel and recently tested the lower boundary of that channel after returning into it from the upward break, all good so far.
The RS-line is also still showing a nice up trending channel and is currently consolidating inside that channel.
The RRG-Lines show some, short-term, weakness. The JdK RS-Momentum line has already crossed below the 100-level and the RS-Ratio line has formed a peak that is lower than the previous peak. By the way, both of these peaks are at seriously high RS-Ratio levels so the longer-term relative trend is still strong.
What we are looking at here is a corrective move within the longer-term uptrend.
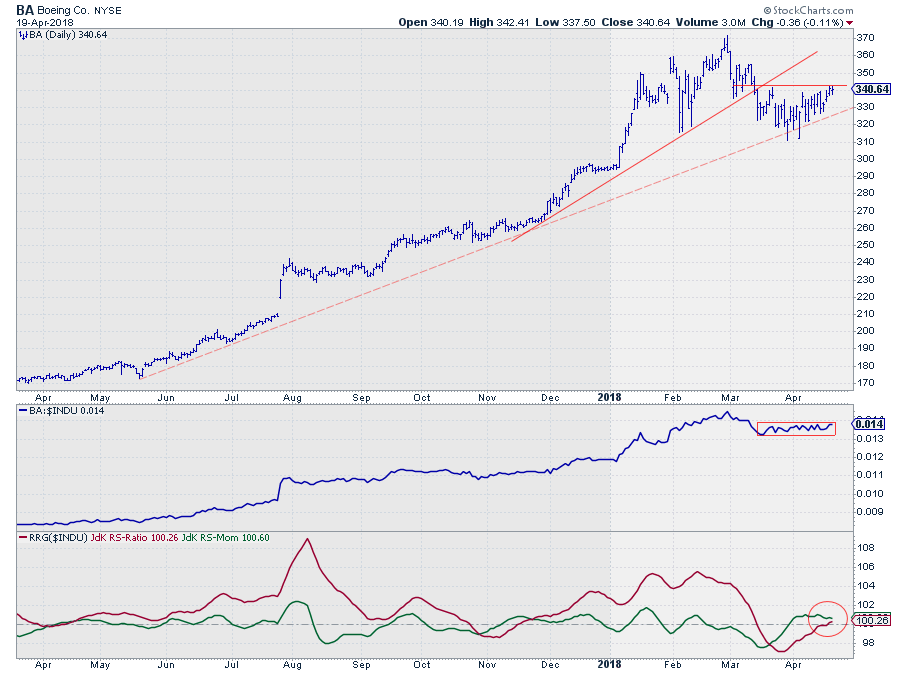 The relative picture on the daily version of the chart shows the RS-line in a sideways pattern while RS-Momentum is close to 100 and slowly descending while RS-Ratio is also close to 100 and slowly ascending. If the decline in RS-momentum continues RS-ratio will soon follow lower.
General Electric - GE
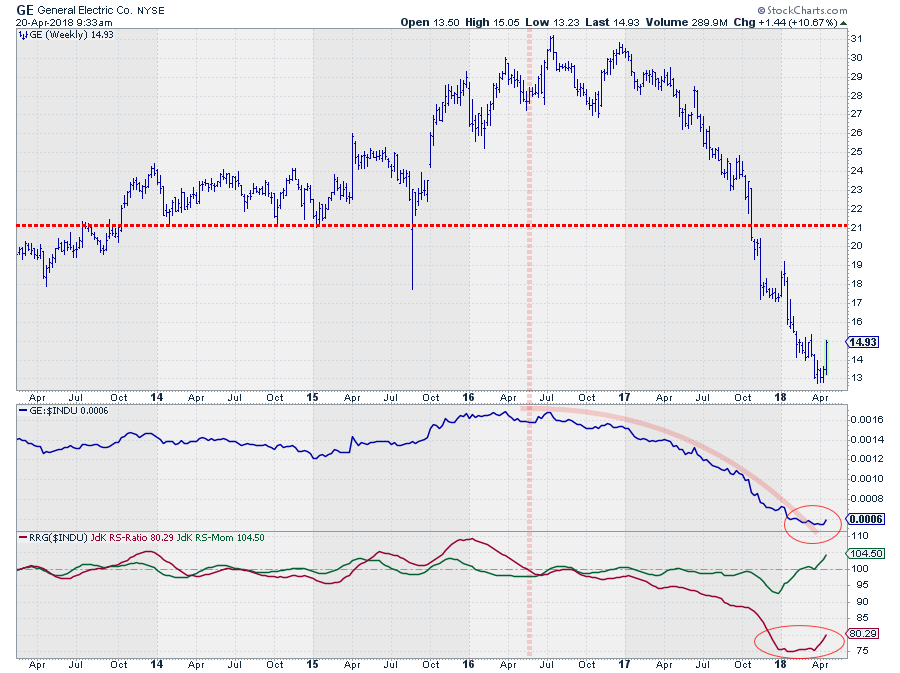 Let there be no doubt. The long-term trend for GE, even after today’s price jump, is still down. It may have started a bottoming process but it is way too early to call for a reversal of the existing trend.
What I am looking for is a short-term counter-trend rally based on the improvement of relative momentum over the past few weeks.
The RS-Momentum line crossed above 100 a few weeks ago following a stabilization in the raw RS-Line. The RS-Ratio line has now responded by turning upward, albeit still at a very low level.
Judged by the low RS-Ratio reading, at least one more rotation from improving back to lagging and to improving again is needed before GE will be able to turn the long-term relative trend around an move over to the leading quadrant of the RRG again.
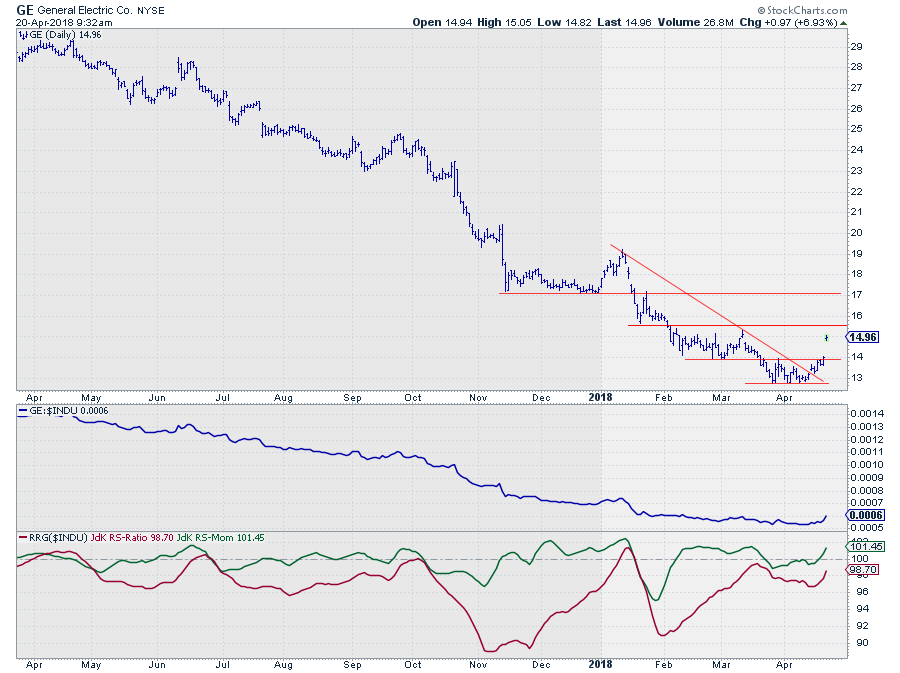 In hindsight, I am so glad that I mentioned GE and showed the daily chart of GE yesterday on MWL ( with 600 witnesses :) ) while commenting that there was a potential double bottom being formed.
Well… this formation has now completed… and it is helping the relative picture to improve, at least for the short-term.
All eyes on CAT(erpillar)
Weekly and daily RRGs
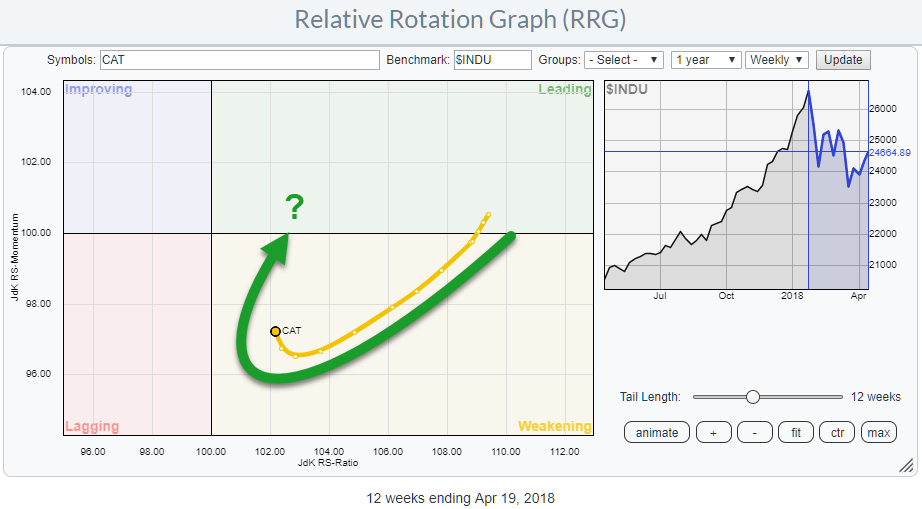 A rotational pattern that turns the tail of a security, inside the weakening quadrant, back up towards the leading quadrant always has my attention.
This is what is becoming visible for CAT on the weekly RRG.
Following that observation, it is always a good thing to check the rotational pattern for that security on the daily RRG to see if it confirms the weekly rotation or if it is conflicting.
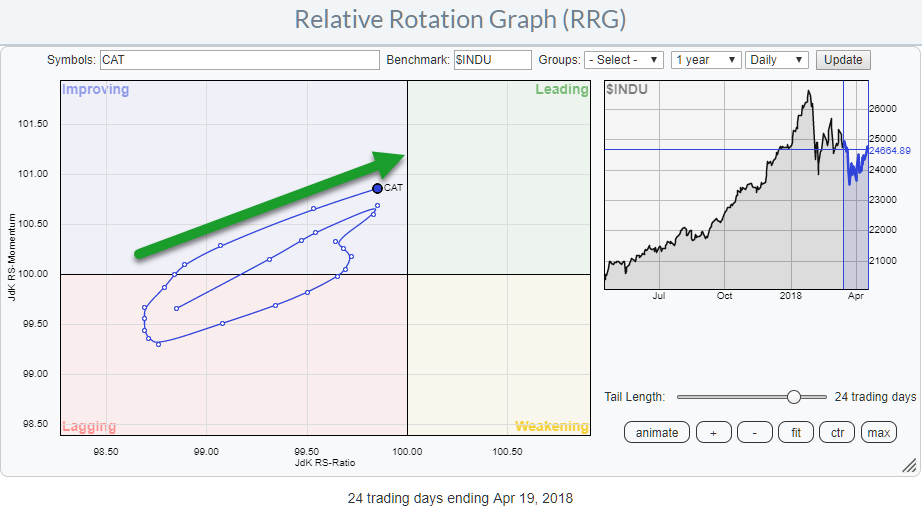 The RRG above shows that at the moment both time-frames are confirming the current strength for CAT.
From the RRG I then switch to my regular charts to check the price and relative trends and come to a conclusion.
Weekly and daily charts
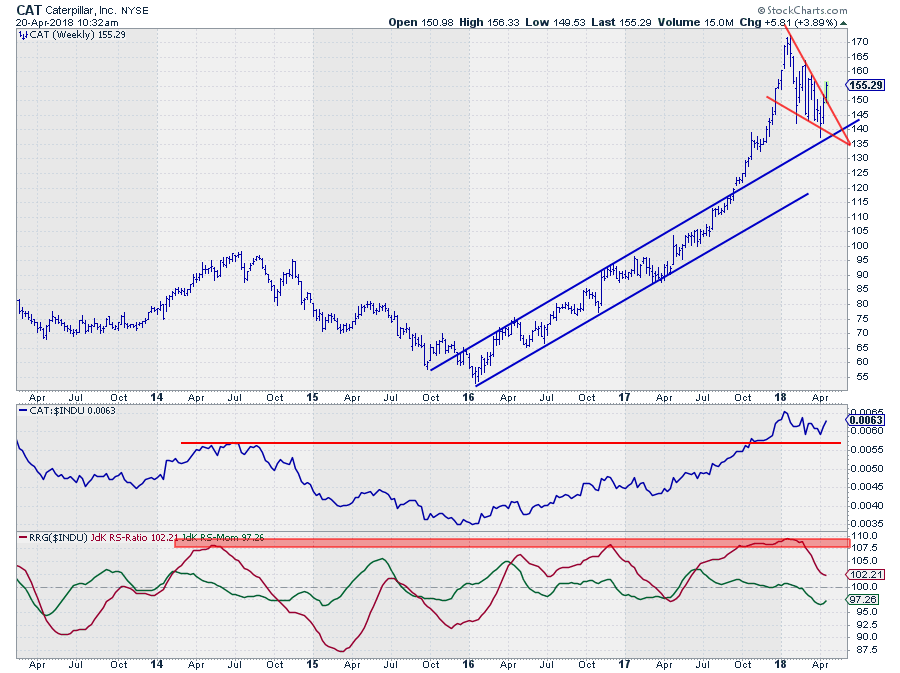 The weekly chart of CAT shows the strong uptrend in price that is in play since early 2016 and the acceleration that followed after the upward break out of the already rising channel.
At the beginning of 2018 CAT peaked around $ 170 and started a consolidation/decline. That decline started to shape like a falling wedge and three weeks ago the correction touched the former rising resistance line which then acted as support (as expected).
The recent rally out of that last low has now broken out of the falling wedge formation to the upside which is a bullish sign. And the minimum price target that can be derived from this wedge is the level of the start of the formation, ie $ 170.
In the lower two panes of the chart, the raw RS-Line is shown in combination with the RRG-Lines.
The RS-Line managed to hold up above its previous peak (2014) which signals that the underlying relative strength is still present. The RS-Ratio line corrected off the extreme levels that we saw late 2017 and into 2018 and RS-Momentum started to curl up a bit already.
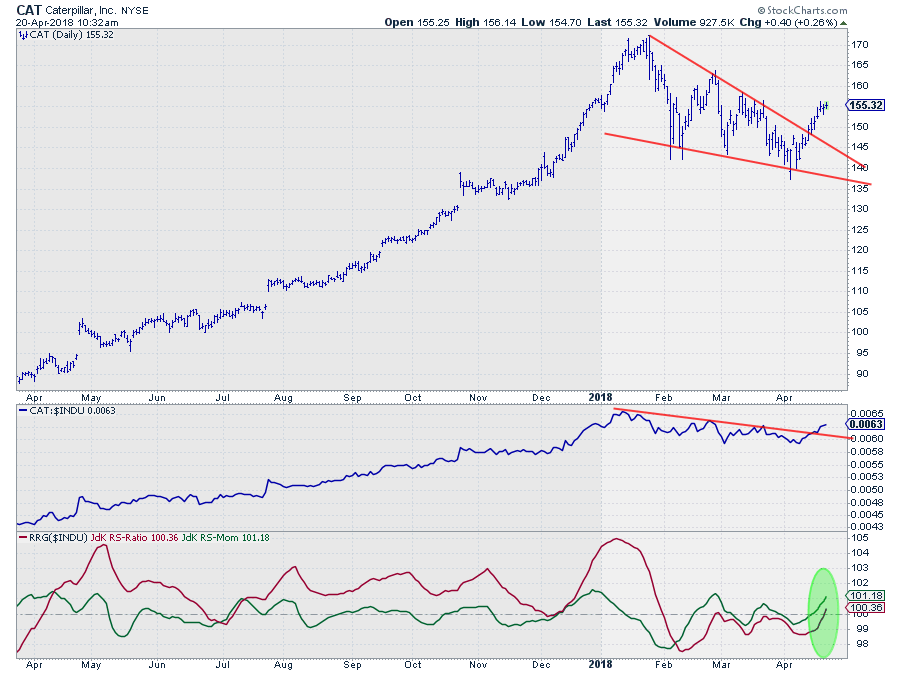
This process is seen in more detail on the daily version of the chart (below) where the RS-Line just broke above the resistance line that connects the relative highs of this year pushing both RRG-Lines above 100 and CAT into the leading quadrant on the daily RRG.
The positive rotation on both the weekly and the daily Relative Rotation Graphs in combination with a solid uptrend and a strong technical break out of a falling wedge (continuation pattern) makes me wanna keep my eyes on CAT in the weeks to come.
To keep a promise
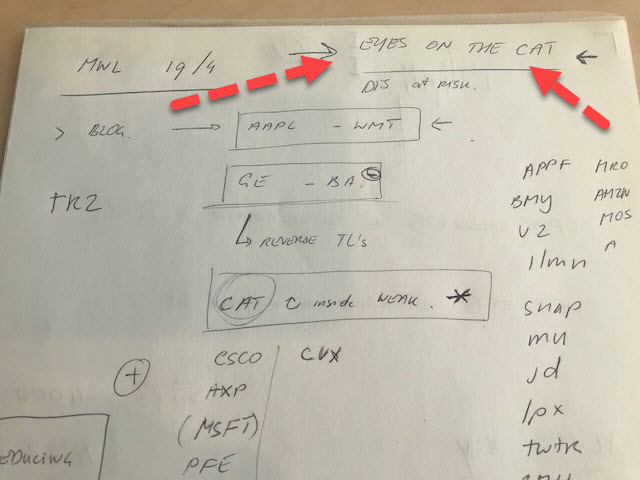
Thos of you who watched MWL yesterday may remember the discussion I had with Tom on CAT and that I said I would attach a snap of my notes which I made prep[aring for the show and while doing that came up with the title for my new (this) article ..... Here it is!
Let me know what you think of this usage of RRG in the comments? If you want to receive a notification when a new article in the RRG blog is published? Simply "Subscribe" and leave your E-mail address.
Julius de Kempenaer | RRG Research
RRG, Relative Rotation Graphs, JdK RS-Ratio, and JdK RS-Momentum are registered TradeMarks ®; of RRG Research
Follow RRG Research on social media:
If you want to discuss RRG with me on SCAN, please use my handle Julius_RRG so that I will get a notification.

