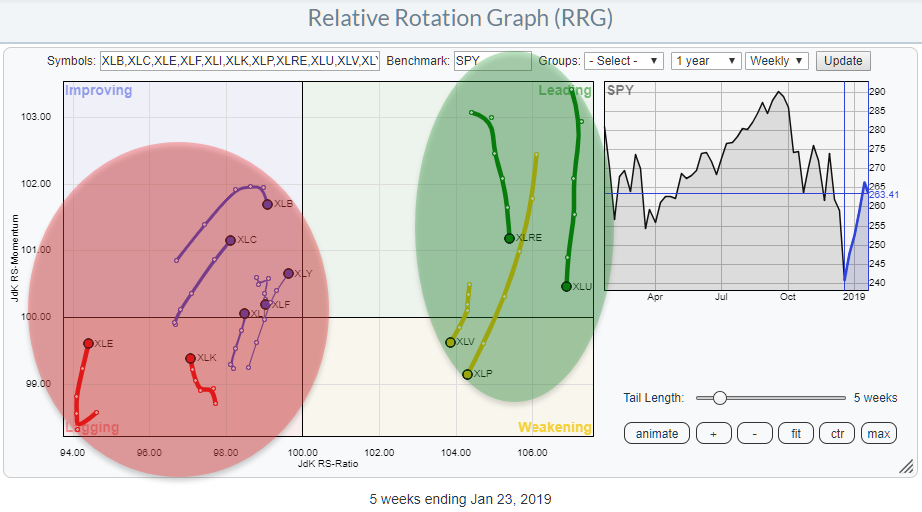
 The Relative Rotation Graph for US sectors is showing a split picture. On the right, we have Utilities, Real-Estate, Consumer Staples and Healthcare. With the exception of Real-Estate maybe, these are generally accepted as "defensive" sectors.
All other sectors (7) are positioned to the left of the benchmark (SPY).
Not only is this universe split in terms of Jdk RS-Ratio level, but it is also split in terms of RRG-Heading. All sectors at the right-hand side of the graph are heading lower, primarily on the Jdk RS-Momentum axis and less so in terms of RS-Ratio.
An opposite move is visible at the left-hand side where most sectors are heading higher on the RS-Momentum scale and only marginally on the RS-Ratio scale. The Materials and Financials sectors have already rolled over downward again inside the improving quadrant, making it very hard to complete a rotation towards or into leading.
Summary
- RRG for US sectors showing a split picture
- Defensive sectors on the right but losing relative momentum
- Offensive sectors still on the left side of RRG
- Tails on defensive sectors heading lower on weekly RRG but curling up on daily
- New focus on defensive sectors suggests weakness ahead for the general market (SPY)
Zooming In On Weekly
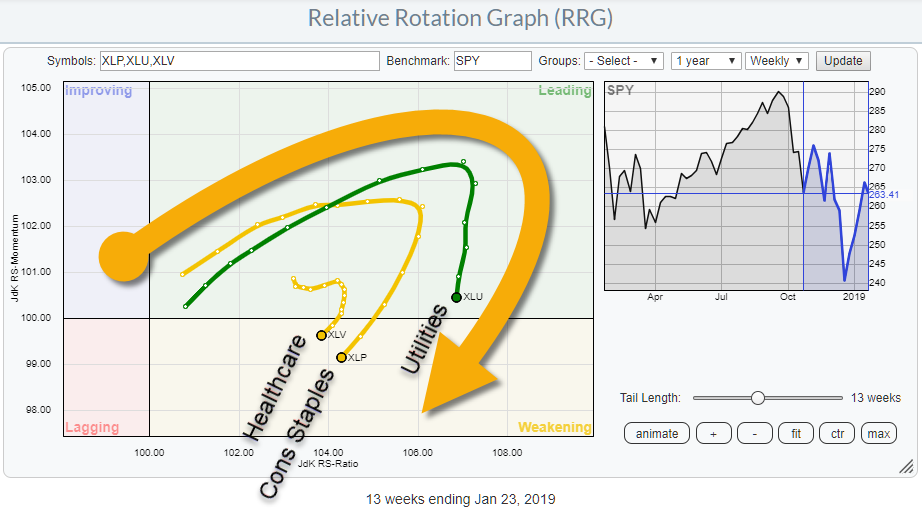 Zooming in on the weekly Relative Rotation Graph shows the leading character for the highlighted sectors. These are Utilities, Consumer Staples, and Healthcare. When the going gets tough, these are usually the sectors that investors flock to for safety.
The Perfchart over the past 180 days (roughly six months) shows this as well.
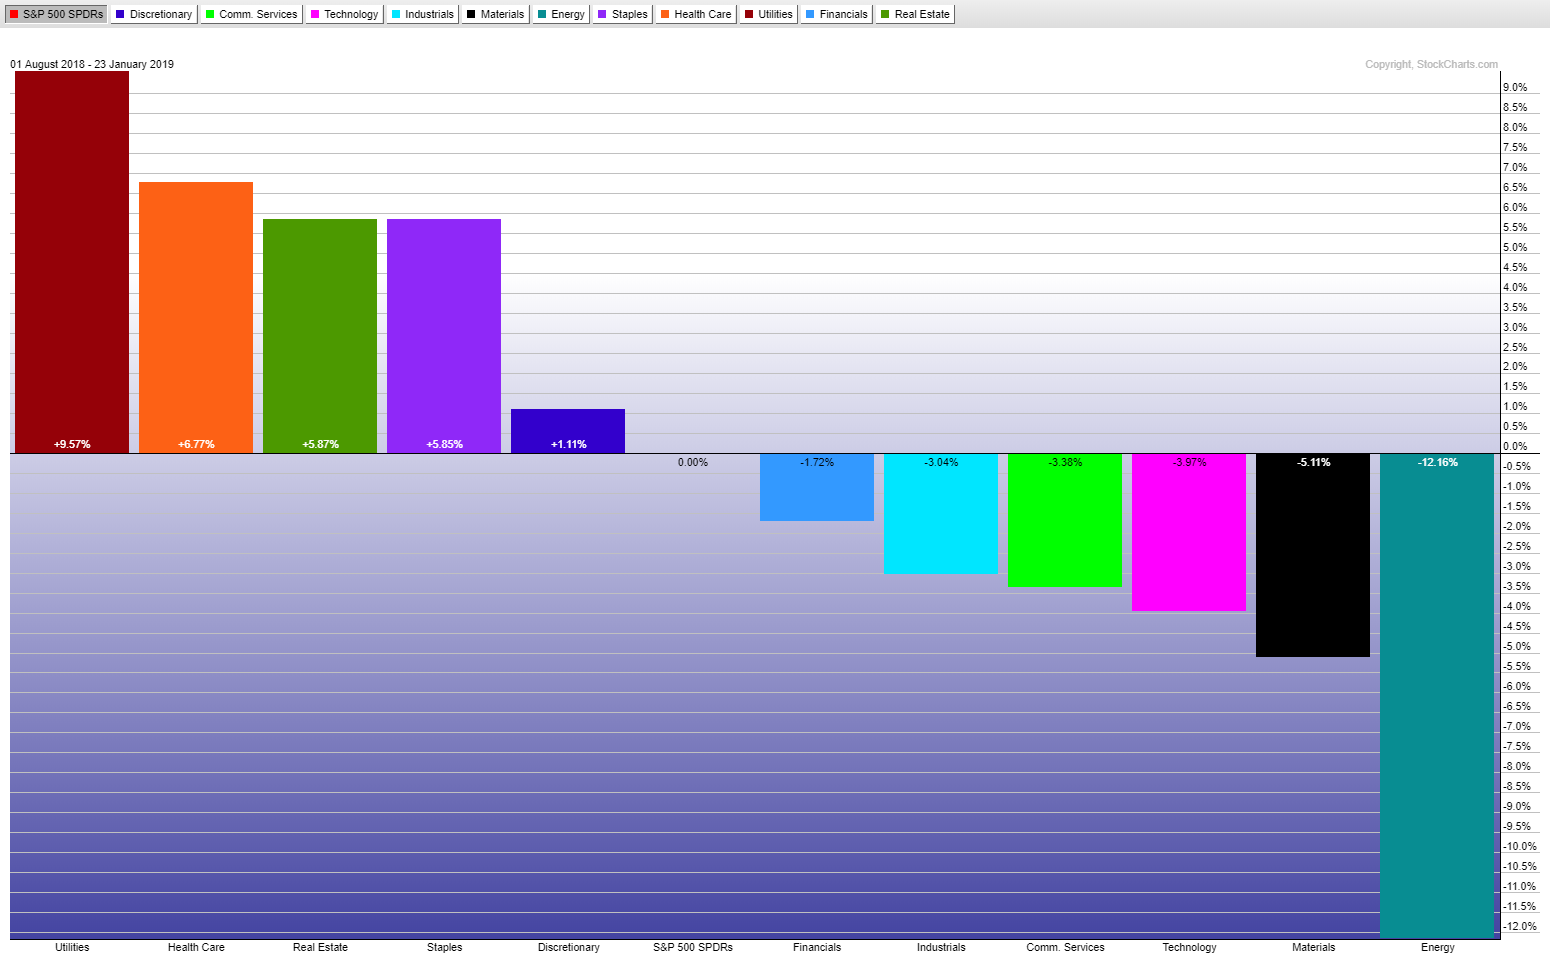
The outperformance for these sectors stands out.
After being the leading sectors for a while, XLU, XLV, and XLP started to roll over inside the leading quadrant five/six weeks ago.
Such a rotation is nothing unusual. Even the strongest soldier needs to take a breather now and then before coming back to battle. Given the distance from the benchmark for these sectors, there is a very good chance that this downward rotation is temporary and defensives will start to rotate back up without making it all the way to the lagging quadrant.
Zooming In On Daily
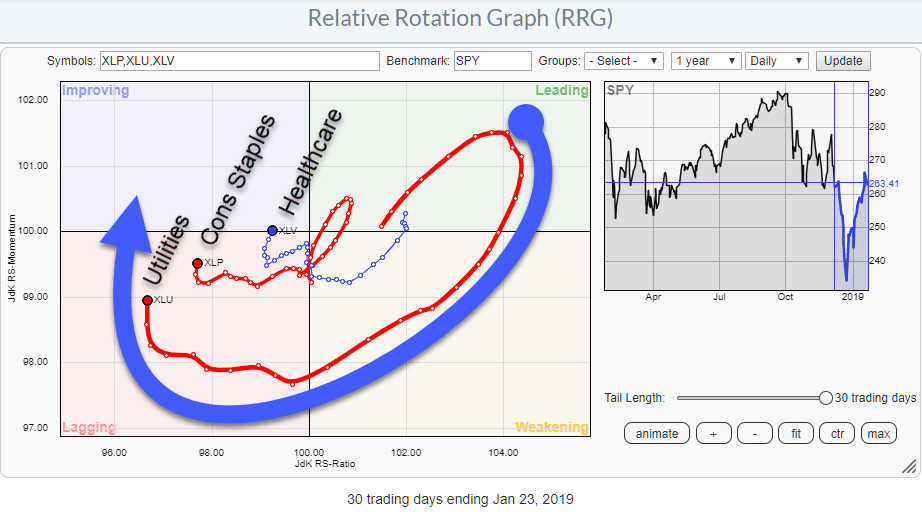 Loading these three "defensive" sectors on a daily version of the Relative Rotation Graph gives the image printed above.
Here we see all three sectors at the left side of the graph but also all three started to curl up again, and Healthcare has just crossed into the improving quadrant already. These upward rotations, albeit in their early stages, suggest that the worst is over for these sectors and that they are about to gain strength again versus SPY.
Utilities
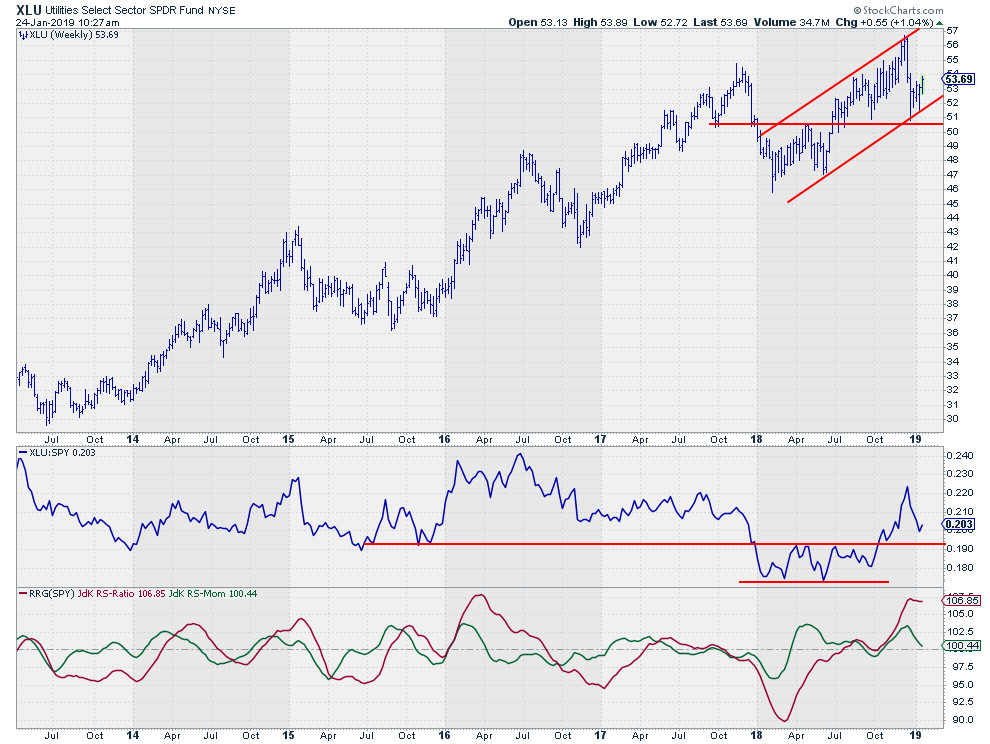 The relative strength line for Utilities against SPY broke out of a sideways range in October and rallied to a new peak late 2018. The decline off of that peak is still well above the former breakout level.
If a new high can be put into place at or above that former resistance level, now support, that will support a further relative improvement for this sector.
On the price chart XLU has held up above horizontal support, and the new (higher) low provides the second anchor for a potential new rising support line.
Consumer Staples
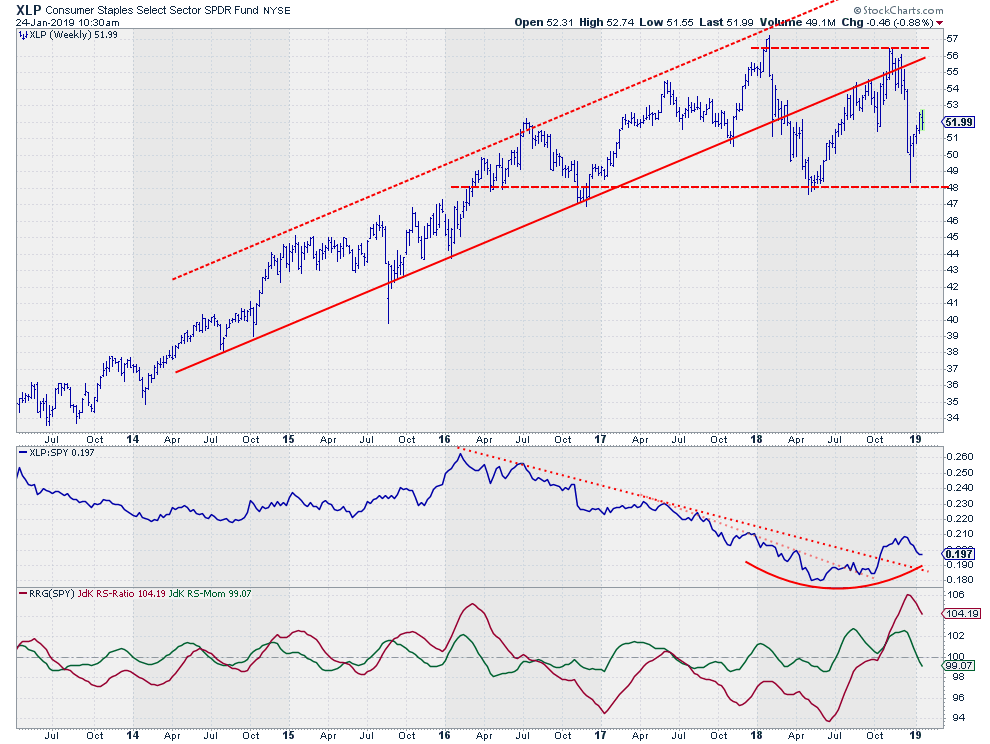 After an almost three-year relative decline, staples managed to break their relative downtrend. The recent pull-back should now find support preferable above the last high (0.19) and then continue higher to support the new uptrend in relative strength.
The JdK RS-Ratio reached very high levels at the end of last year which warranted a setback. I am looking for RS-Momentum to start curling back up again before RS-Ratio drops below 100.
The rotation on the RRG suggests that that is very well possible.
Healthcare
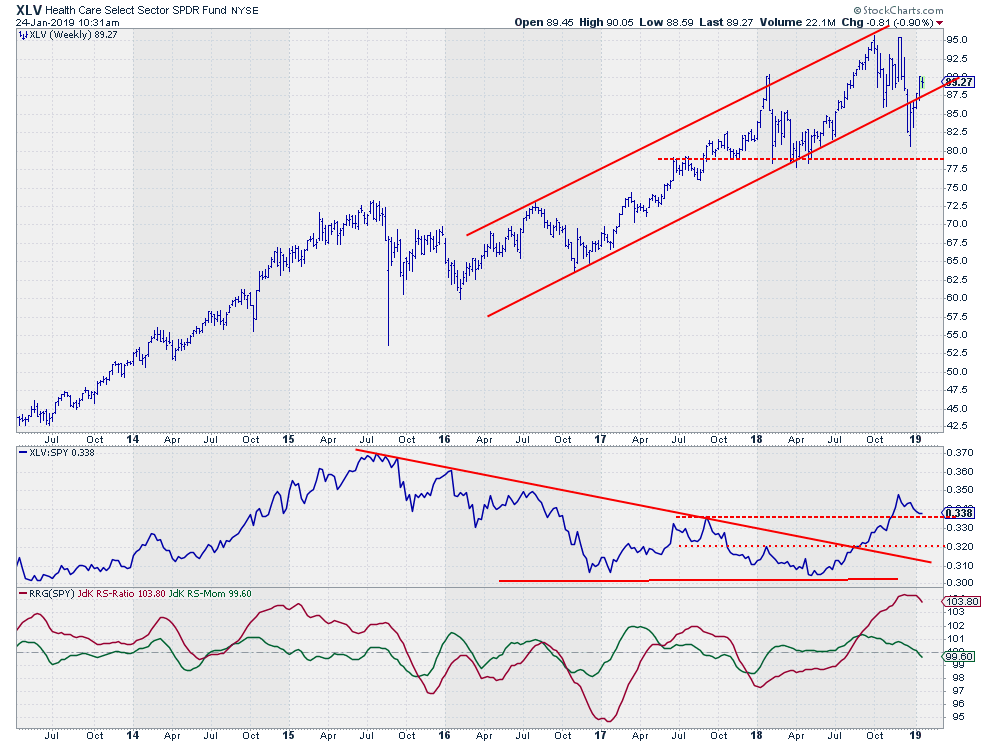
The Healthcare sector started to outperform the S&P in the summer of 2018 and reached a temporary, peak towards the end of the year. The current decline off that high is still well within the boundaries of what can be called a "healthy" correction.
Given the high level of the RS-Ratio line, a return of RS-Momentum above 100 and thus a rotation back to the leading quadrant on the RRG is expected in coming weeks/months.
Implication for SPY
For the general market that suggests that defensive sectors are about to get back into focus which usually is not a good sign for the market as a whole.
It is hard, if not impossible, to "predict" when the high will be set but based on the defensive rotations mentioned above and the general structure of lower highs and lower lows on the weekly S&P chart the odds seem stacked against a, much, further rally.
Let me know what you think of this usage of RRG in the comments below. If you would like to receive a notification when a new RRG blog article is published, simply "Subscribe" with your email address using the form below.
Julius de Kempenaer | RRG Research
RRG, Relative Rotation Graphs, JdK RS-Ratio, and JdK RS-Momentum are registered TradeMarks ®; of RRG Research
Follow RRG Research on social media:
If you want to discuss RRG with me on SCAN, please use my handle Julius_RRG so that I will get a notification.


