
How to Identify the Different Types of Bounce and Reversal Price Action in Candlestick Charts
One of the key elements of successful selling short, and also for bargain hunters or those using buy-on-the-dip strategies, is to be able to properly identify which of the many types of upside price action is prevalent and what each means for the next day to few days of price action. These are commonly called “bounces,” where the price moves up during a downtrend for a day to a few days. “Reversals” refer to the final low that turns the stock back to the upside.
There are several kinds of candlesticks that form during bear or correcting markets which must be properly identified so that the technical trader can adapt and anticipate the near-term price action for either selling short or buying into a sudden momentum run in the bottom.
These types of candlestick patterns form due to which market participants are actively trading in the stock and whether they are upside buyers or downside short sellers.
1. Buy-to-Cover, BTC: candlesticks that form when the preponderance of selling is due to technical traders selling short, HFTs, and pro traders trading the downside. They are anticipating that the stock will move down and when it does, they buy-to-cover in order to take their profits. Buy-to-cover candlesticks are profit-taking price patterns that cause a bounce in the downtrend.
2. Buy-on-the-Dip, BOD: candlesticks that form in down-trending stocks when uninformed and less-informed, or under-educated technical traders buy into a bear market or a correction. They assume, without the proper knowledge base, skill, or experience, that this level is where the correction will end, or soon end, and that they are buying into a stock at a better price. These are usually smaller-lot buyers who need better education and often find themselves holding a stock in a bear market. This also is a bounce pattern in a downtrend.
3. Bargain Hunting Dark Pool, BHDP: these candlestick patterns are true reversal patterns. They form when Dark Pools, giant-lot and large-lot investors determine that the stock has fallen to extremely good bargain price levels. Bargain hunters come out wherever there has been a previous “Buy Zone” of the Dark Pools at which they were accumulating a few weeks to a few months ago.
These are 3 distinctly different Market Participant groups, each with their own agendas, trading or investing strategies, trading platform venues, experience and skill, and capital base. They create their own unique candlestick patterns, and they are easily recognized once a technical trader learns what type of price action each creates when they trade.
Below is the stock chart for TRV, and it has two of the bounce candlestick patterns.
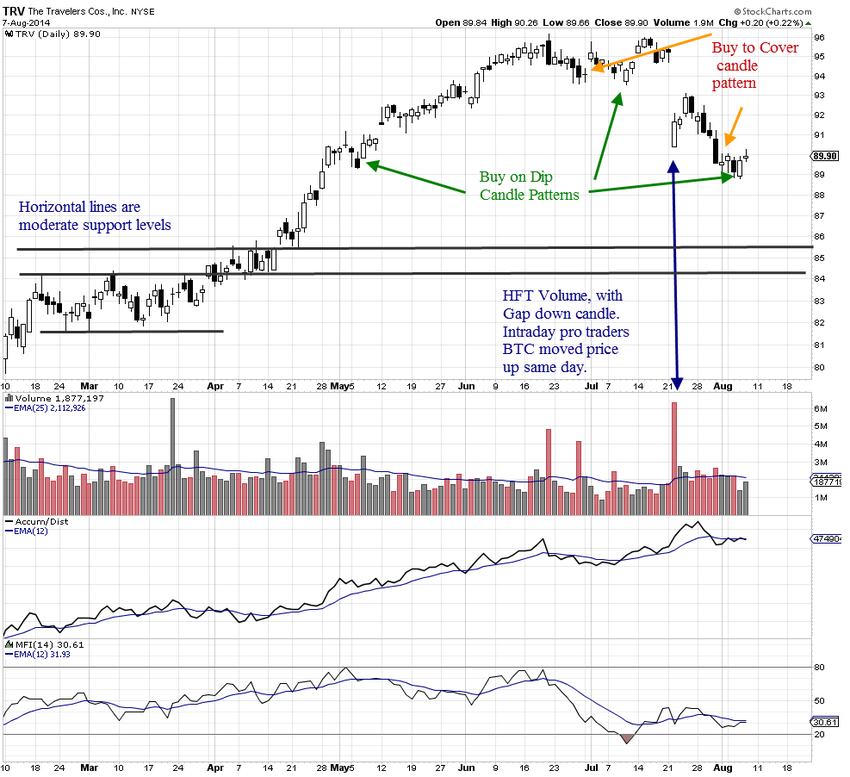
The buy-on-the-dip strategy often is used by mistake in a stock that is already trending down and at risk for more downside action due to lack of support. HFTs often cause reactions from retail and smaller funds.
Buy-on-the-dip candlestick soften gap due to the use of “at-market” orders.
Buy-to-cover candlesticks are smaller than buy-on-the-dip candles, and they rarely gap due to more sophisticated orders being used, which help to control the exit price.
Trade Wisely,
Martha Stokes CMT
www.TechniTrader.com
info@technitrader.com