
Monitoring purposes SPX: Sold long SPX on 7/16/15 at 2124.29= gain 1.05%. Long SPX on 6/25/15 at 2102.31.
Monitoring purposes GOLD: Flat
Long Term Trend monitor purposes: Flat
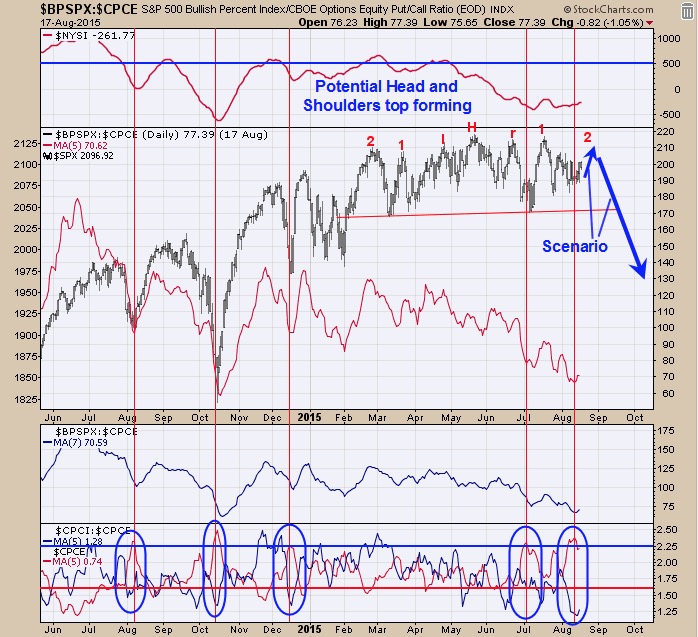
This week is option expiration weeks which normally has a bullish bias. The put/call ratio indicators have more importance during option expiration week. The bottom window in the chart above are a couple of option related indicators we follow. The red line is the equity put/call ratio with a 5 period moving average. A bullish condition is indicated when this indicator reaches above the upper blue boundary line. The blue line represents the put/call ratio for the index/put/call ratio for the equity with a 5 period moving average. A bullish condition is indicated when this indicator reaches below the lower red boundary line. Both of these option indicators have reached bullish levels and it is option expiration week. The next window up is the SPX. The pattern forming appears to be a Head and Shoulders top where the left and right shoulders have multiple humps. The last hump for the right shoulder may be in progress now. Market can stagger a little higher short term. If indeed this is a Head and Shoulders top than volume and VIX should drop in the coming days. This potential Head and Shoulders top have a measured downside target near 1975 on the SPX. Page two has a scenario for a VIX sell signal method.
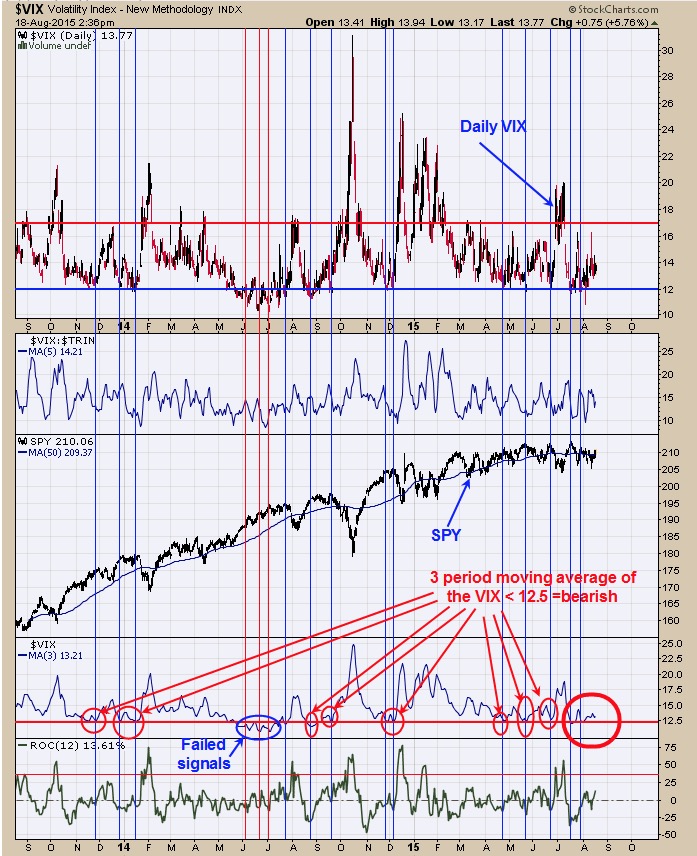
Market appears to be nearing a high. The second window up from the bottom is the 3 day average of the VIX. Short and intermediate terms tops have formed when the 3 day average of the VIX reached below 12.50. The chart above goes back two years and shows the times when the 3 day VIX reached below 12.50 (identified with blue verticals lines). The last two minor tops of mid and late July where identified with the 3 day average of the VIX reaching below 12.50. Current reading of this indicator comes in at 13.21 and not far from the bearish level of 12.50. This is option expiration week which usually has a bullish bias an if market does work higher into Friday, there is a good change the 3 day VIX may reach below 12.50. Staying on the sidelines.
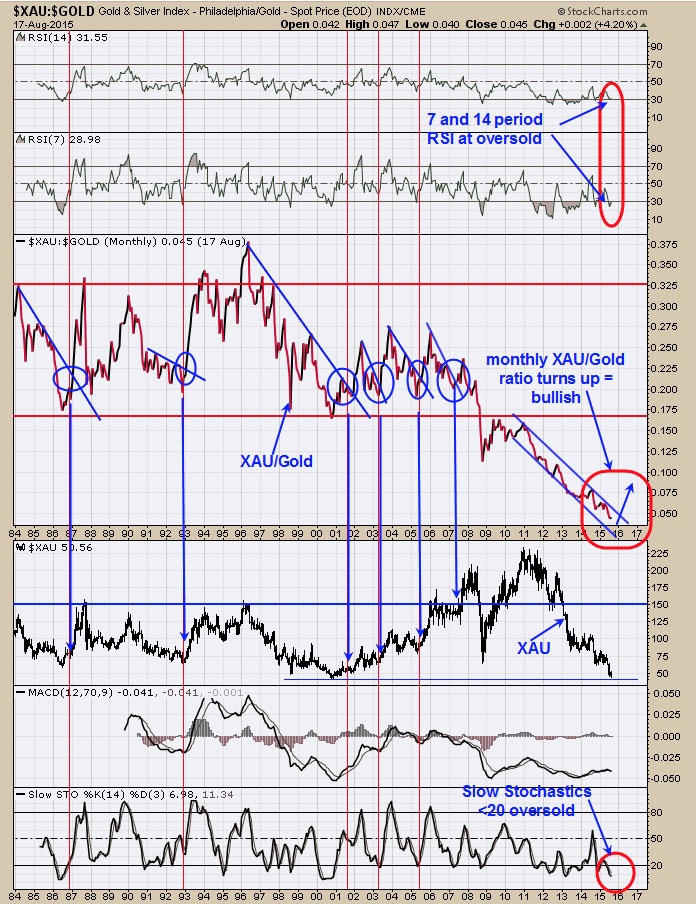
The COT report remains bullish for the last three weeks as the Small Speculator and Commercials remain in bullish territory. The chart above is the monthly XAU/Gold ratio going back to 1984. The RSI 14 period; RSI 7 period; MACD and Slow stochastics are on the monthly XAU/Gold ratio. Therefore we are looking at the extremes in the XAU/Gold ratio to determine bottoms and tops in the XAU index. We have drawn trend line break analysis on the XAU/Gold ratio. On the trend line breaks, worthwhile bottoms formed in the XAU (identified with blue arrows). Since the 2011 top in the XAU the XAU/Gold ratio has been trending down and so far has not given a bullish signal with a trend line break to the upside. When and if it does will be a longer term bullish sign for gold and gold stocks. Notice that the RSI (14); RSI (7); MACD and Slow Stochastics are in or near oversold levels suggests the downside on the XAU/Gold ratio is oversold and may be near a low. A break above upper blue boundary line near .05 on the XAU/Gold ratio will be a bullish sign.
Tim Ord,
Editor
For examples in how "Ord-Volume" works, visit www.ord-oracle.com. New Book release "The Secret Science of Price and Volume" by Timothy Ord, buy on www.Amazon.com.