
Monitoring purposes SPX: Sold long SPX on 7/16/15 at 2124.29= gain 1.05%. Long SPX on 6/25/15 at 2102.31.
Monitoring purposes GOLD: Flat
Long Term Trend monitor purposes: Flat
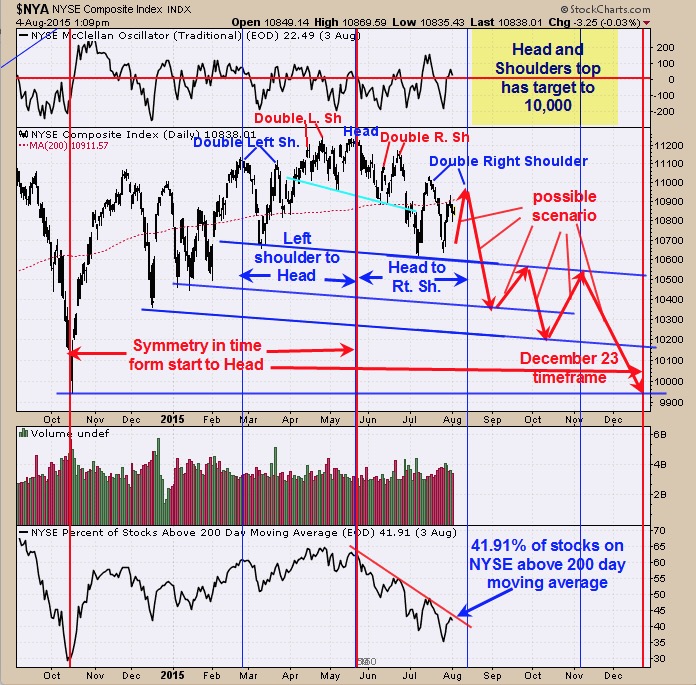
We have been looking at the symmetry of the market and is appears to be continuing. Above is the NYSE which appears to be drawing a Head and Shoulders top with multiple Left and Right shoulders. To keep the current symmetry another Right Shoulder high is due near the August 13 timeframe which is symmetric in time to the double Left shoulder. A possible target to the top of the second Right Shoulder is near 11,000. If the current symmetry is going to continue form last October low, than volatility will continue around the December 23 timeframe and may look like a mirror image from October 2014 low to May 2015 high (identified with red arrows). The October 2014 low (where pattern began) to the May 2015 high (Head of Head and Shoulders top) marks the half way point of the pattern and add that time to the May High comes in at December 23 where the pattern may end. We mention before this potential Head and Shoulders top has a downside target near 10,000 on the NYSE and the October 2014 low comes in near that level and an ideal target for the next intermediate term low. A possible buy signal could come in near 10600 to a sell signal near 11,000. We will see what lines up. Sold long SPX on 7/16/15 at 2124.29= gain 1.05%.

The top window in the chart above is the 10 day MA of the TRIN and readings above 1.30 have been a bullish sign for the market. Current reading is 1.19 and near the bullish level. The window below the SPY is the daily 15 period moving average of the SPY/TRIN ratio. It has been a bullish sign for the market when the SPY/TRIN ratio reached the lower boundary line which currently comes in near the 200 level. If the market can push down another day or two and the 10 day TRIN reaches 1.30 or higher and the SPY/TRIN ratio reaches near 200 or lower, a bullish signal could be triggered and something we will be watching for. Yesterday we mistakenly stated that 10 day TRIN near 1.30 was bearish but met to say it was bullish and the SPY/TRIN ratio below 200 is bullish and not bearish as was said yesterday. Sorry of the confusion. Still neutral for now. Contacts us for free 30 day trial.

The COT report for last Friday showed the Commercials short 21,584 contracts. It has been a bullish sign for gold when the Commercials are less than 50,000 contracts short. The Small Speculators are net short 6,695 contracts. It has been a bullish sign for gold when the Small Speculators are net short contracts for gold. The current COT reading suggests gold is near a low for short term. The chart above is the GDX daily chart. There is a short term positive divergence for the RSI where RSI has been making higher lows as GDX has made lower lows. The GDX/GLD ratio as been making higher lows as GDX is making lower lows and the GDX/GLD ratio usually leads the way. The bottom window is the SLV/GLD ratio. It’s a bullish sign for both Gold and Silver when Silver is outperforming Gold and that is what happening when the SLV/GLD ratio is rising and this ratio has been rising since early July. There appears to be a short term bottom developing but how strong the bottom will be is to be determined on the next rally. Momentum is still down on the monthly, weekly and daily charts. We are most interested in the monthly charts as when it turns up could lead to a multi month if not a multi year rally. Still neutral for now.
Tim Ord,
Editor
For examples in how "Ord-Volume" works, visit www.ord-oracle.com