
Monitoring purposes SPX: long SPX on 11/2/15 at 2104.05
Monitoring purposes GOLD: Long GDX on 11/20/15 at 13.38.
Long Term Trend monitor purposes: Flat
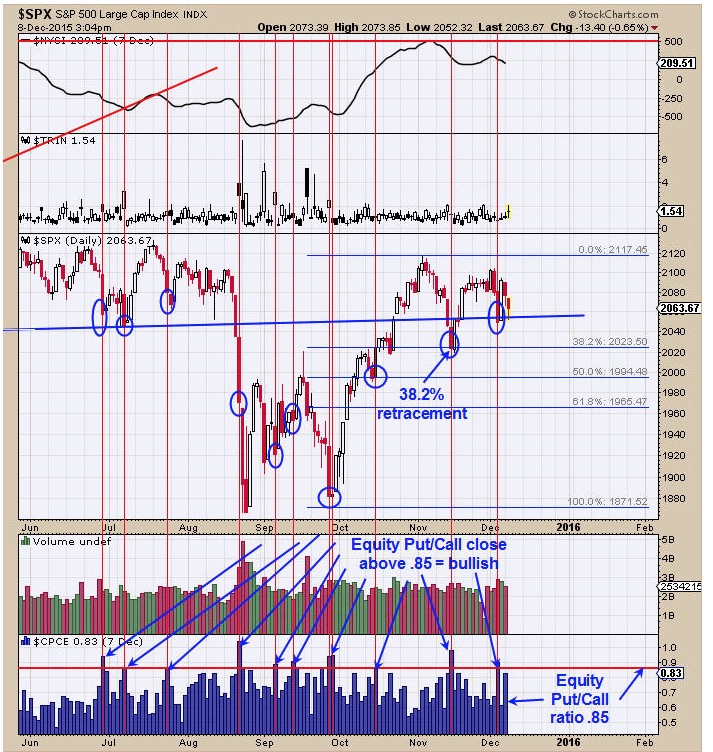
The last low that formed on November 16 which retraced 38.2% the previous rally that started on September 29. The shallow retracement suggests the pattern that is coming next should be a consolidation rather than a topping pattern as the market failed to reach the 50% retracement level. On October 8 the McClellan Oscillator reached +303 and this high reading suggests an initiation of an uptrend. The bottom window is the CBOE Equity Put/Call ratio and readings .85 and above are a short term bullish sign. On December 3 this ratio reached .85 suggests a low was near by. Yesterday we showed the CBOE put volume/ CBOE Call volume with a 5 period moving average. Readings above 1.10 have appeared near short term lows in the market as well and that reading was also reached on December 3 (we mistakenly wrote November 3). As option expiration nears (next week) theses ratio become more important and start to carry more weight.
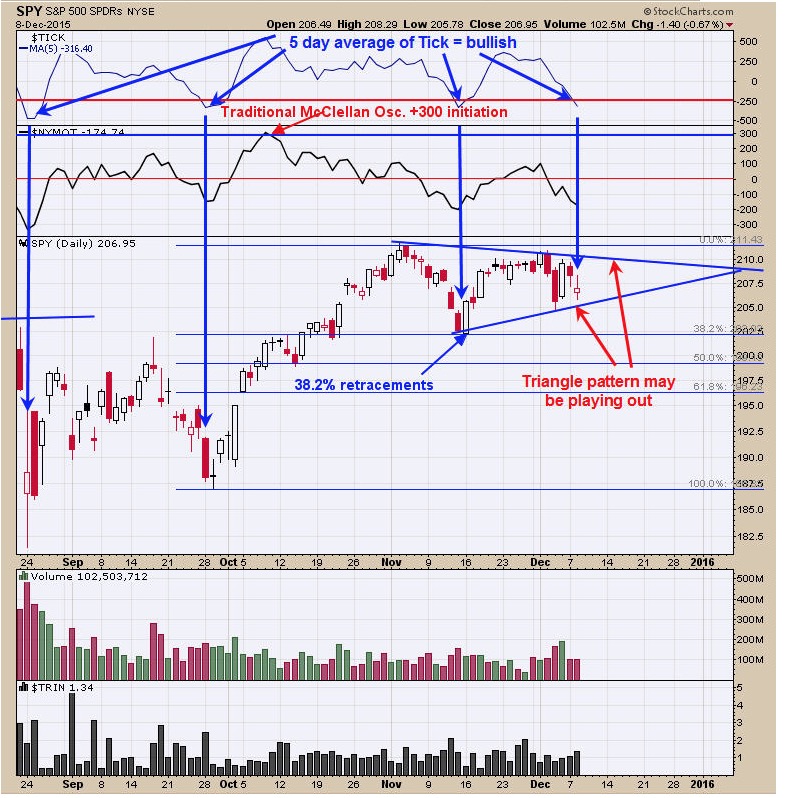
The top window is the 5 day average of the Tick close and readings below -250 are a bullish sign and today’s reaching came in at -316.40. The “Triangle” pattern that was mentioned on a previous report could be playing out. This “Triangle” pattern that started back in Mid December has only retraced 38.2% of the previous rally and suggests that this “Triangle” will break to the upside. More “Churning” may go on possible into the FOMC meeting which is next Tuesday and Wednesday. Since the Advance/Decline line for the SPX hit a new high recently it suggests at some point the SPX will also hit a new high and keeps the trend bullish for now.
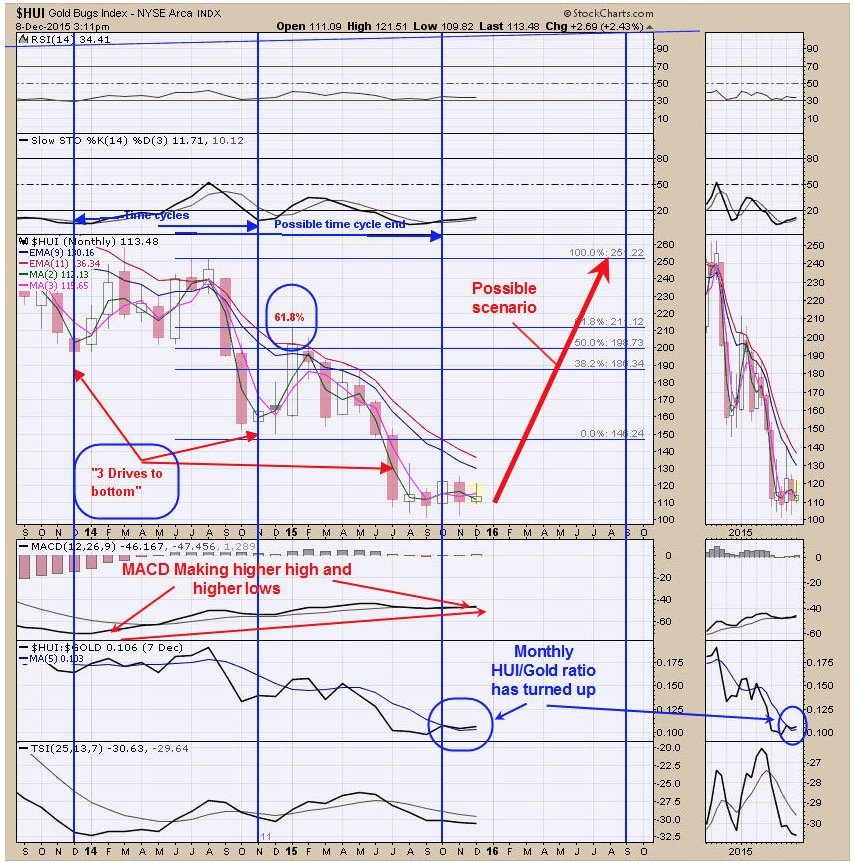
We have showed this chart in the past and is updated to the current timeframe. The chart above is the monthly HUI index. The pattern that appears to be forming is a “Three Drives To Bottom”. The key element for this pattern is that the retracement off of the second low should retrace at least 61.8% of the previous decline and this one did. Also there is symmetry in price and time and the time for a low was projected for October plus or minus a month and the low so far came in September. The monthly MACD has been making higher lows and higher highs as HUI made lower lows and a positive divergence. The HUI/Gold ratio has turned up also a bullish sign. A “Three Drive to Bottom” has a measured target to where the pattern began and if indeed this pattern is “Three Drives to Bottom” a projection to the 250 range is possible. Remember that the Commercials are in the most bullish position in the last 12 months and they are considered the smart money. Long GDX on 11/20/15 at 13.38.
Tim Ord,
Editor
For examples in how "Ord-Volume" works, visit www.ord-oracle.com.
New Book release "The Secret Science of Price and Volume" by Timothy Ord, buy on www.Amazon.com.