
Among the hybrid technical indicators is the Accumulation/Distribution (A/D) line. It combines factors of volume with momentum, and price to reveal buying or selling pressure, often contradicting the immediate price trend or anticipating reversal.
A/D is calculated by combining price range with volume:
( ( Close – Low ) - ( High – Close ) ) ÷ ( High – Low ) x Volume
This calculation is applied to each session and then added to or subtracted from the cumulative index value. An analysis of the formula reveals how price, volume and momentum all come into play in the A/D line.
The index moves between a range of +1 and -1. When the line moves into positive territory, buying pressure is greater than selling pressure; and the opposite is in effect when the index value moves into negative territory.
For example, the chart of Booz Allen Hamilton (BAH) demonstrates this combination of price and volume enrich the indications of price trends and coming change.
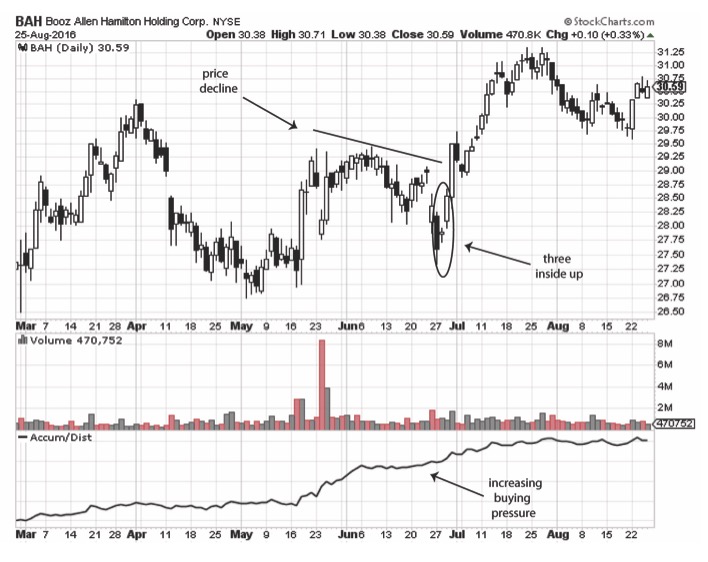
On this chart, price was moderately volatile during the four months between March and June, obscuring what was likely to occur next. Price moved between $26 and $30 but a clear trend was not obvious.
By adding in the A/D line, the buying pressure was clearly observed. It was most significant during the month of June. At this same period, price was declining, and did not look bullish in any respect. However, the A/D buying pressure anticipated a bullish sentiment. This was confirmed with a strong bullish reversal candlestick, the three-session three inside up. This marked the end of the downtrend and the turning point to what became a strongly bullish reversal.
In spite of interim uncertainty in price direction, the chart generally showed a gradual bullish trend. The A/D line leveled out the interim volatility. The A/D line trended upward throughout the entire chart, adding confirmation of the bullish trend. At the end of the chart, A/D was at a high level, even as price moved into a plateau. This indicated a likely resumption of the upward priced move, that would not be contradicted until the A/D line began moving downward.
This indicator adds value to chart analysis, especially when considered in situations with short-term trend uncertainty.
Michael Thomsett blogs at TheStreet.com, Seeking Alpha, and several other sites. He has been trading options for 35 years and has published books with Palgrave Macmillan, Wiley, FT Press and Amacom, among others.