
SPX Monitoring Purposes: Flat.
Monitoring Purposes GOLD: Long GDX on 1/29/19 at 21.96.
Long Term Trend SPX Monitor Purposes: Sold long term SPX on 10/24/19 at 3010.29=gain 1.49%; Long SPX on 10/14/19 at 2966.15.
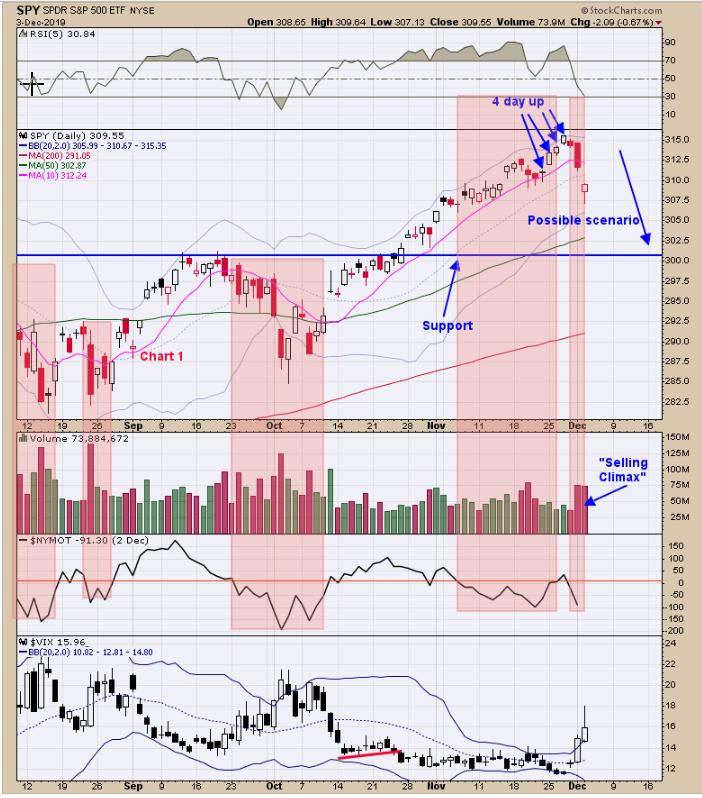
On yesterday's report, we said "Going into last Wednesday the SPY was up four days in a row. Four days up in a row, the SPY closed higher at least once 81% of the time in the next five days. Today's volume jumped near 100% compared to several days before producing a possible short-term 'Selling Climax.'" Today's gap down on the SPY may cancel the four-days-up theory, but there are still two days left to prove the theory wrong. If the market does test last Wednesday's high, a sell setup could develop. As previously mentioned in our reports, around holidays market reversals are common and Thanksgiving turned out to be a high. The next holiday is Christmas and the last Christmas holiday marked a low. With the McClellan Oscillator below "0" and the Summation Index heading lower, the trend is now down. We will be looking for the next bearish setup and a test of last Wednesday is possible.
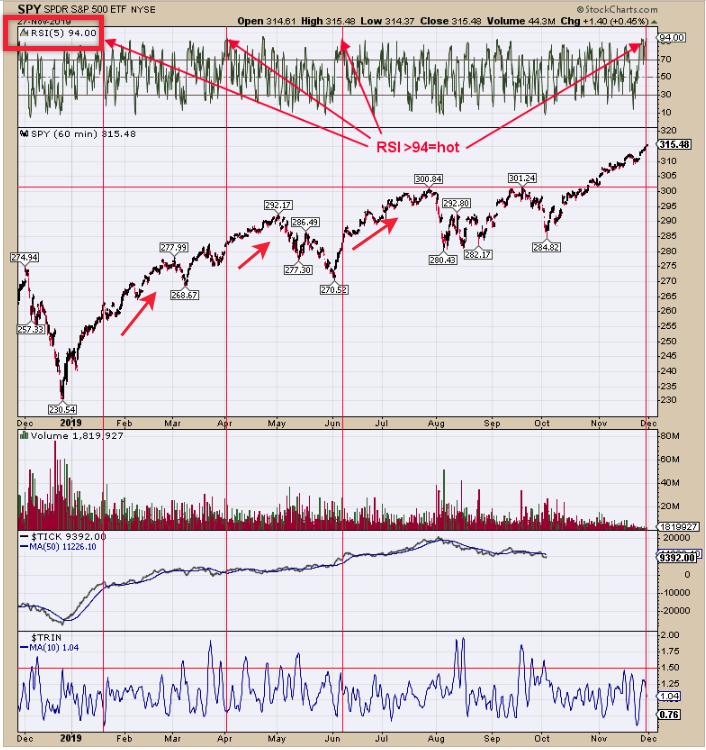
Above is the hourly SPY chart going back to last Wednesday's close with a 5-period RSI. When the hourly 5-period RSI reaches >94, the market has strong momentum and the final high is usually has formed. The close on last Wednesday's RSI was 94, which is so far the high close. With the four-days-up rule and with the hourly RSI (5), there is a possibility last Wednesday's high could be tested. The potential test could setup a sell signal. Being patient for now.
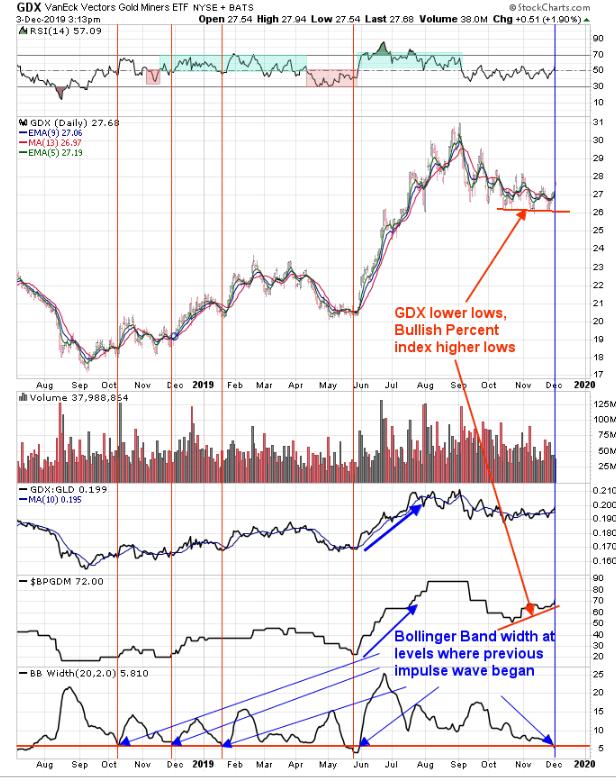
We've updated this chart from yesterday. The bottom window is the Bollinger Bandwidth for GDX. When the Bollinger Band narrows, the Bollinger Bandwidth goes to a low level. The current low reading in the Bollinger Bandwidth (bottom window) is near levels where previous impulse wave began. A narrowing of the Bollinger Band suggests an impulse wave is about to begin. Today's gain in GDX suggests the possibility of an impulse rally beginning. Also, notice that, over the last month, GDX has made lower lows as Bullish Percent index for the Gold Miners has made higher lows, showing that more stocks are on Point and Figure buy signals even though GDX made lower lows, which is a bullish divergence. Long GDX on 1/29/19 at 21.97.
Tim Ord,
Editor
www.ord-oracle.com. New Book release "The Secret Science of Price and Volume" by Timothy Ord, buy at www.Amazon.com.