
SPX Monitoring Purposes: Long SPX 10/22/20 at 3453.49.
Monitoring Purposes GOLD: Long GDX on 10/9/20 at 40.78.
Long Term SPX Monitor Purposes: Long SPX on 10/26/20 at 3400.97
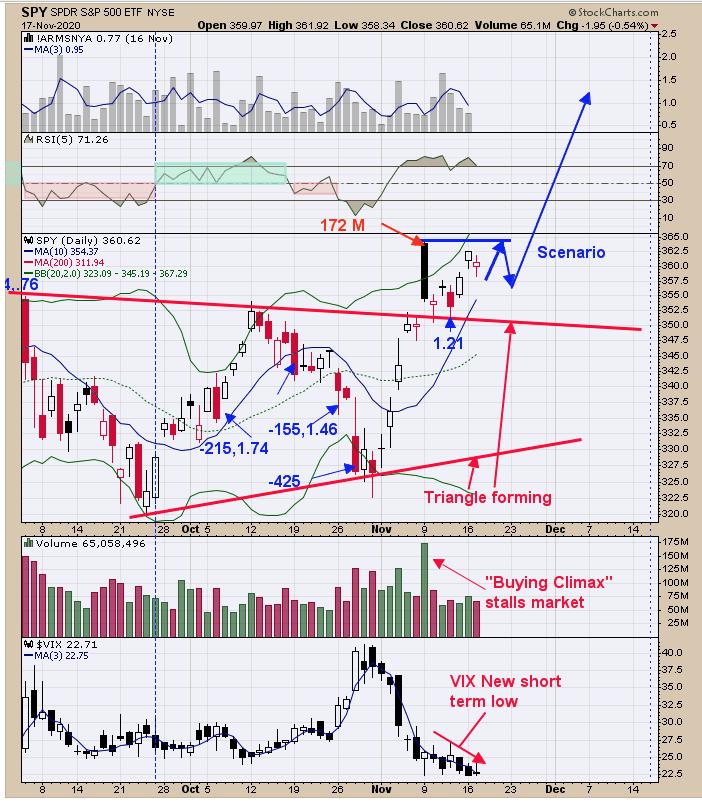
This week is options expiration week and November expiration has odds being higher nearly 64% of the time. The bottom window is the VIX, which is trending down and a short-term bullish sign for the SPY (VIX trades opposite of the SPY and when there is a divergence; would suggest a reversal in the market). November 9 had volume of 172 million shares. To get through the November 9 high, volume should at least reach 163 million (preferably more) and anything less will suggest resistance. So far, the SPY has not touched the November 9 high and, until it does, the volume rules apply. The TICK closed today at -252, which is bullish, but if TICK closes above +300 in the coming days on the potential test of the November 9 high and with volume less than 155 million (10% less than 172 Million), that will imply resistance. So far, the picture appears short-term bullish.
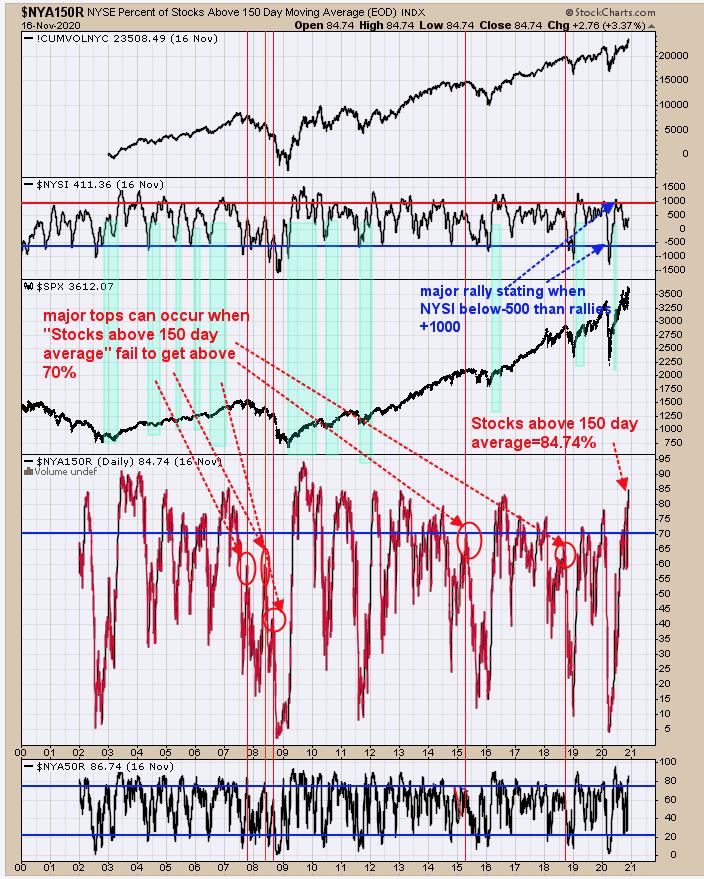
Above is a long term view of the health of the market. This chart dates back to 2000. The second window up from the bottom is the NYSE stocks above their 150-day average. Markets weaken before a major top forms. One clue that a market is weakening is when stocks above their 150-day average fail to get above 70%. We marked in red vertical lines the times that occurred. The stocks above their 150-day average currently stand at 84.74% and in a strong position. There can be pullbacks in the short-term, but the market is not setup for a major top forming anywhere near here. In general, near-term and intermediate-term, the market is a healthy position.
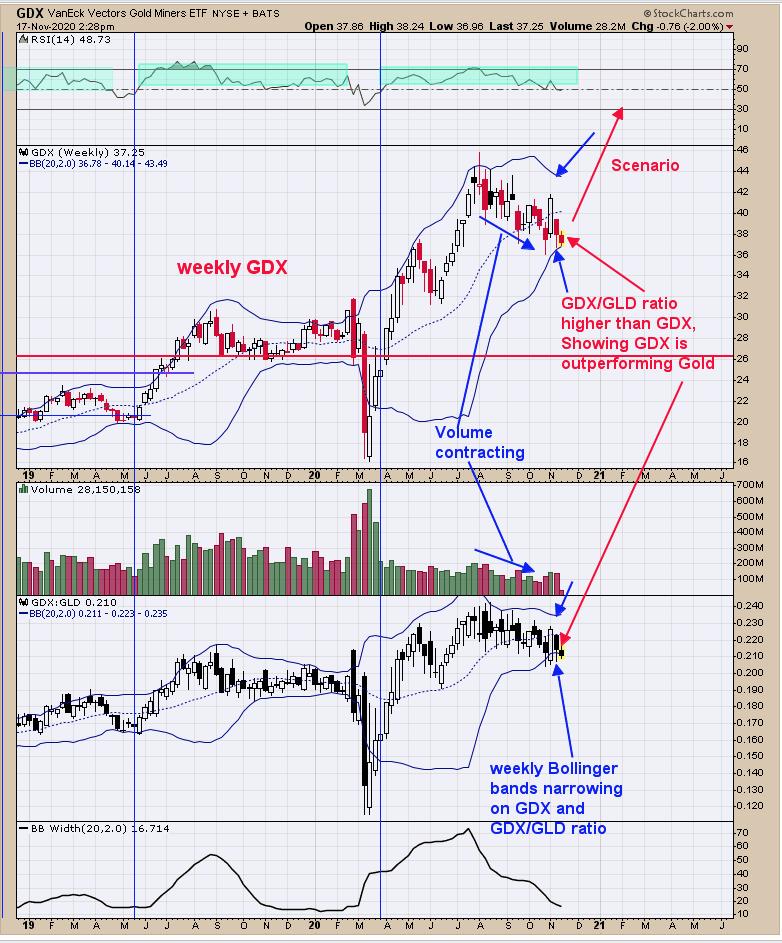
As we said yesterday, "As we pointed out in the past, the Bollinger Bands are pinching on both the weekly GDX and GDX/GLD ratio. The pinching of the Bollinger bands suggests the corrective phase is near an end and an impulse wave is about to begin. Since the Bollinger bands are pinching on a weekly timeframe, the coming impulse wave may last several months (we are thinking rally could last into February). Notice also that GDX is at the low of the candle two weeks ago and GDX/GLD ratio is near the lower third of the candle from two weeks ago, showing GDX/GLD ratio is stronger than GDX. This shows that GDX is stronger than GLD, which is what happens in bull moves for GDX. There was a bump in volume on the rally in GDX two weeks ago, which is also a bullish sign." As in the past, the rally will come when least expected, which should be sooner rather then later according the Bollinger bands pinching. Long GDX on 10/9/20 at 40.78.
Tim Ord,
Editor
www.ord-oracle.com. New Book release "The Secret Science of Price and Volume" by Timothy Ord, buy at www.Amazon.com.