
SPX Monitoring Purposes: Sold 11/27/20 at 3638.61=gain 5.36%; Long SPX 10/22/20 at 3453.49
Monitoring Purposes GOLD: Long GDX on 10/9/20 at 40.78
Long Term SPX Monitor Purposes: Long SPX on 10/26/20 at 3400.97
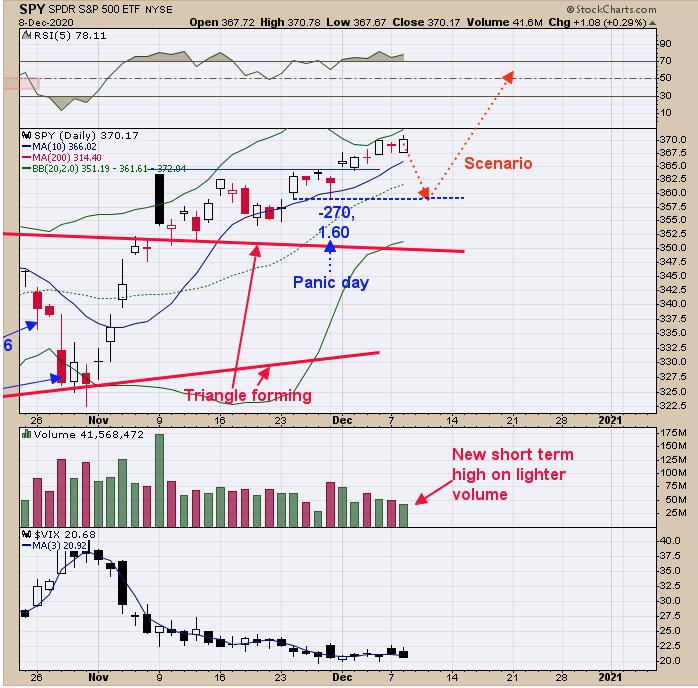
There is evidence that a pullback to 350 SPY may not be in the cards. If there is going to be a pullback, it should be this week. Yesterday we said, "A 'panic day' on the chart above refers to the panic in the TICK and TRIN on 11/30 (TICKs close -270 and TRIN close 1.60). 'Panic days' produce a support level (in this case, around the 360 SPY range) and, if the market tests that area again and another panic reading is recorded by the TICK and TRIN, then support is indicated. This is the week before option expiration, where whipsaws are common. Intermediate term is bullish, but short term leans bearish. Possible support could develop near the 360 SPY range." There is not a whole lot to add to the above other than today's rally to new high came with reduced volume and a bearish sign. Staying neutral for the short term and bullish intermediate term.
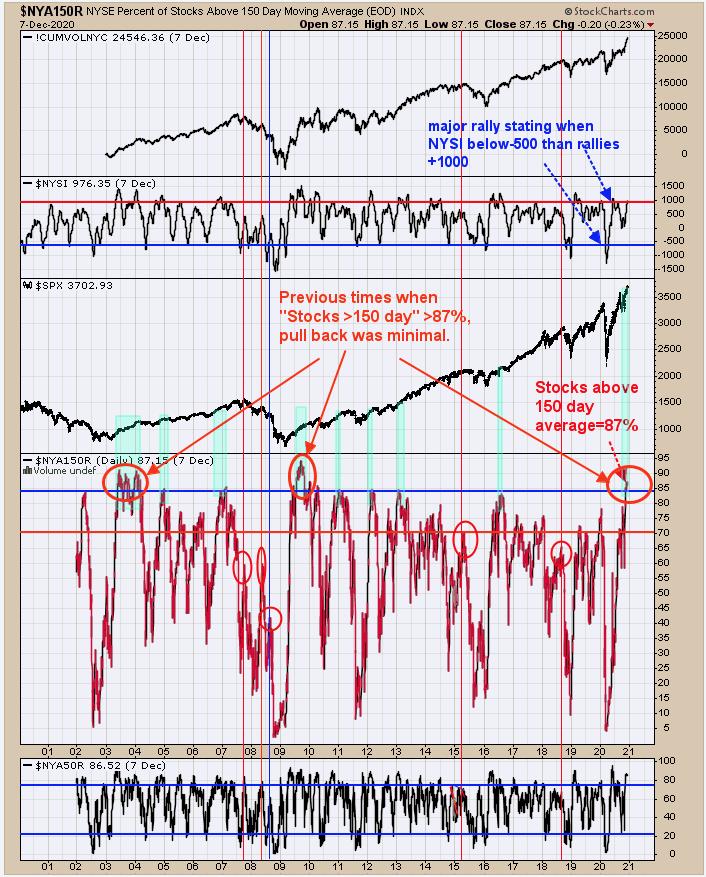
The chart above goes back to 2002. It shows the times when "Stocks above their 150-day average"; over 87% of the time (like now), the pullbacks where minimal. "Stocks above 150-day average" weaken first before a larger pullback commences; that is not happening here, at least not yet. Looking at 2003 period (red circle) the "Stocks above 150-day average" stayed mostly above 85% and the SPX had near a pullback. The same goes for 2009 (second red circle). At one point, we were looking for a pullback to the 3500 SPX range, but with the continued strength in the "Stocks above 150-day average" holding above 85%, it suggests a worst case scenario for a pullback is to 3600 SPX range. Another note; this week is the weakest of the December weeks, and if there is going to be a pullback it should be this week.
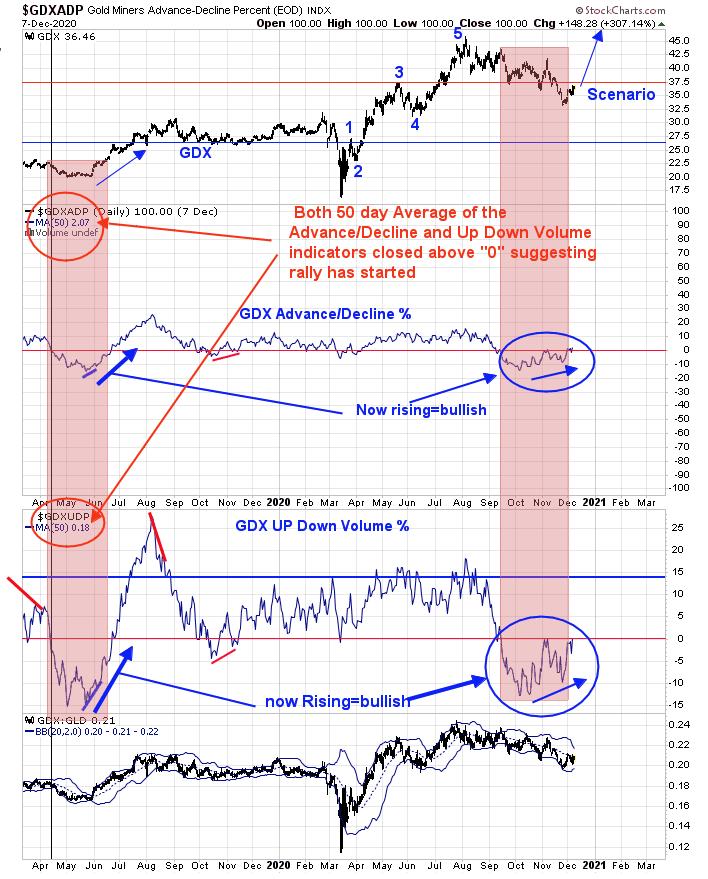
Here is a little more confirmation that GDX may have turned the corner to the upside. The bottom window is the 50-day average of the Up Down Volume percent. When this indicator is making higher lows as GDX is, a bullish divergence is present (Check), and when it close above "0" (check again), that suggests the bottom may be in. The next window up is the 50 day average of the Advance/Decline Percent. When this indicator is making higher lows as GDX is making lower lows, a bullish divergence is present (check) and when this indicator closes above "0" it suggests the bottom may be in (check). Long GDX on 10/9/20 at 40.78.
Tim Ord,
Editor
www.ord-oracle.com. New Book release "The Secret Science of Price and Volume" by Timothy Ord, buy at www.Amazon.com.