The aerospace industry ($DJUSAS) is a component of the industrial sector (XLI). Industrials have been a key driver of the S&P 500 since the turn of the century. There's a clear relative uptrend channel in play that was broken temporarily in 2009 as the 2007-2009 bear market came to an end. Except for that slight blemish, industrials have been a "go to" sector for the bulls for the past 15 years. Check this out:
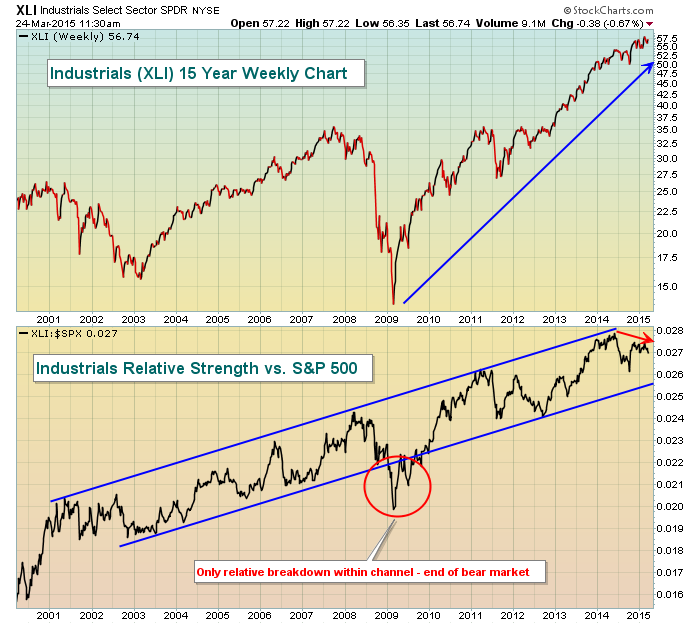
Since that 2009 bottom, industrials have moved straight up with few pullbacks and their relative strength has remained in its relative uptrend channel, easily surpassing the performance of the S&P 500 over this period. Note, however, that while industrials have recently made fresh absolute highs, their relative strength has actually deteriorated somewhat since the first half of 2014, indicative of rotation away from the sector and into other areas of the market. That's not necessarily a bad thing as movement towards relative support generally suggests solid reward to risk opportunities within the space.
That brings me to Aerospace, which has been a very strong part of the industrial sector. It's also fared quite well vs. the S&P 500. The following chart illustrates not only the absolute strength in aerospace, but also its relative strength vs. both the S&P 500 and its industrial peers:
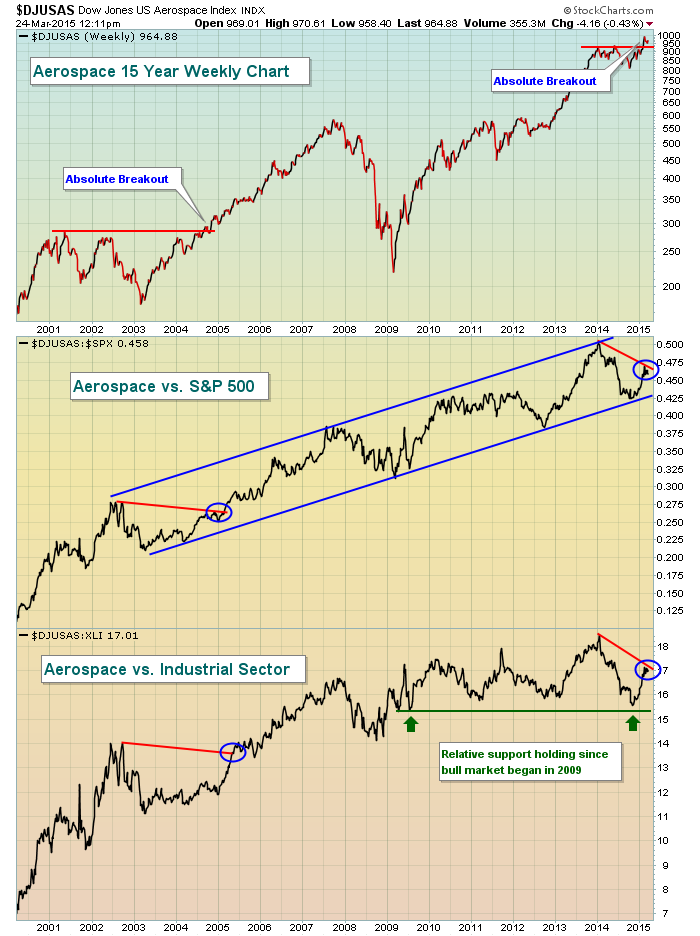
The red lines and blue circles above show similarities between 2015 and 2005. In both instances, aerospace was breaking out to fresh new absolute price highs while its relative strength lagged. Many times that will create opportunities as breakouts encourage new buyers and money rotates back into the space on a relative basis. There's no guarantee that's what happens here, but having some degree of exposure in aerospace would seem to make sense technically.
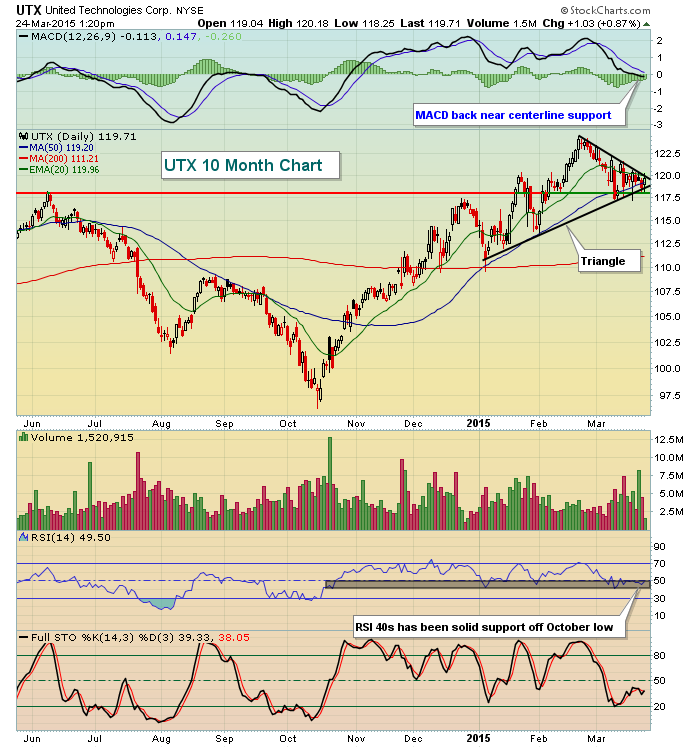
United Technologies (UTX) is a component of both the aerospace industry ($DJUSAS) and the Dow Jones Industrial Average. UTX has been consolidating on its daily chart in a bullish symmetrical triangle pattern, while also taking a breather on its long-term weekly chart and approaching its rising 20 week EMA. Check out both its short-term and long-term prospects below:
Now the long-term weekly chart:
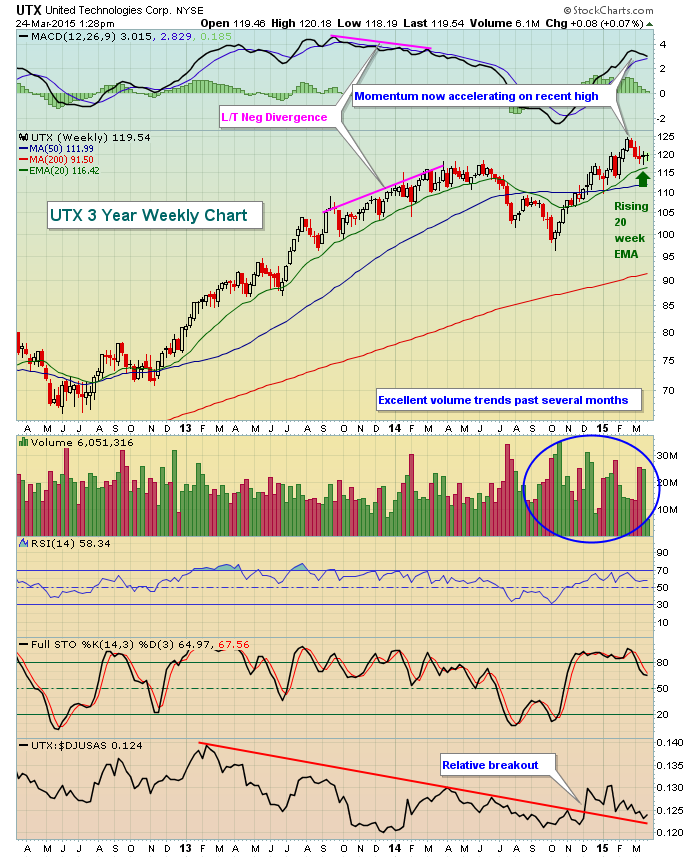
While UTX consolidates on its daily chart near price support and its rising 50 day SMA, the weekly chart is showing significant improvement in momentum, volume and relative strength. UTX also provides an element of safety (relatively speaking) as it's a $108 billion market cap company and offers a solid 2.10% dividend. Should the aerospace group return to favor on a relative basis, UTX would seem to be setting up as a beneficiary.
Happy trading!
Tom
