 Hello! I'm Tom. Welcome to my new blog - "Trading Places with Tom Bowley."
First off, I'd like to thank you for stopping by. I'm thrilled to be writing blogs and hosting webinars exclusively at StockCharts.com while doing so among the finest technical analysts on the planet. This ground-breaking article will provide you with my background and my approach to stock trading. I think you'll see that I really strive to keep trading simple - the KISS theory if you will. Before I discuss my trading style and strategy, let me give you my professional background. I graduated from Benjamin Franklin University in Washington DC with a BS in Accounting. I launched my accounting career in 1983 and passed the CPA exam in 1984. I was later made a Principal in one of the largest regional CPA firms in the Baltimore/Washington metropolitan area where I was responsible for auditing many of the Firm's largest clients in several industries, most notably banking, retail and manufacturing. As Chairman of our Accounting and Auditing committee, I was responsible for our Firm's quality control measures. Needless to say, my roots are in fundamental analysis. After leaving public accounting, I co-founded Invested Central, which is a stock trading subscription service that combines fundamental, technical and historical analyses. Invested Central was formed in 2004 and I was its Chief Market Strategist through last week before accepting a position here at StockCharts as Sr. Technical Analyst. I hosted multiple webinars throughout the week, analyzing primarily the U.S. stock market and answering individual stock questions, as well as general technical analysis questions. I've co-hosted national business talk radio shows, spoken at financial conferences and literally taught thousands of traders around the globe how to trade equities more effectively.
Throughout my public accounting career I had a passion for technical analysis and stock trading. As a self-taught technician, I was intrigued by the teachings of John Murphy and still consider his technical analysis writings to be among the very best today. In fact, I would have to say that John Murphy and legendary baseball manager Earl Weaver of Baltimore Orioles are two of my biggest influences as far as how I approach the stock market. You may not understand the connection with the latter, but let me explain. Earl Weaver managed the Baltimore Orioles during the late 1960s and throughout the 1970s when I was a baseball fanatic growing up in the Maryland/Virginia area. I could quote baseball statistics back then much like I track stocks now. Earl made extensive use of historical statistics to create matchups that were favorable either to his batters or to his pitchers. This rather unique strategy at the time ended up landing Earl in Major League Baseball's Hall of Fame. One of the books he wrote, "It's What You Learn After You Know It All That Counts" could be applied to many areas of life, certainly the stock market. Never stop learning. Earl's use of statistics to manage baseball really appealed to the numbers side of me. I always say "I've never met a spreadsheet I didn't like" and it's the truth. I love numbers and analyzing numbers. I have one very large spreadsheet, tracking all of the daily closes of the S&P 500 since 1950. I've analyzed the data and use many of its statistical revelations in my trading strategies. For example, did you know that the 28th to the 6th of every calendar month has accounted for ALL of the gains of the S&P 500 since 1950? That's right, roughly 33% of the calendar month has accounted for 100% of the S&P 500 gains. I'll talk about historical tendencies often in this blog.
Next, let's talk technical analysis and how I approach the stock market.
There are a few themes I'll discuss on here frequently. They are, in no particular order, as follows:
(1) Reward to Risk Ratio
One of the common denominators that links successful traders is their ability to harness emotions and manage risk. It's not easy, but you need to think of trading as a business and your capital as your product. If you own a business and a certain product isn't selling and it becomes unprofitable, smart business owners will let go of the loss leader fairly quickly, cutting their losses early. You should think of a stock trade in the same manner. That stock is on board to do one thing for you - to make you money. Many traders will enter a stock without a plan at all. They have no target and worse yet, they have no stop loss level. This is a plan suited for disaster and one that will result in you trading solely off emotion. You might as well open a window and throw your hard-earned money out.
(2) Understand Your Technical Indicators
The combination of price and volume trumps every other technical indicator in my view. Personally, I'd be careful as to how many technical indicators you use. Too many indicators result in what I term "analysis paralysis". If you watch too many indicators, you'll see nothing but mixed signals and never be able to pull the trigger on a trade with confidence. You'll second guess yourself from the moment you enter a trade until the time you exit. Instead, I focus on the price/volume combo and use a few momentum indicators to confirm or refute what price/volume is telling me. I'm a momentum trader, pure and simple. You've probably heard the Wall Street adage, "the trend is your friend". I trade by that simple rule.
During primary uptrends, I combine the use of price support, moving averages, candlesticks and momentum oscillators to identify high reward to risk trades. It's not about being right every trade, it's about managing risk. Toss your ego to the side because if you're looking for 100% gratification in your trading strategy you're setting yourself up for failure. Instead, approach every trade with a certain amount of skepticism and be prepared to exit if a trade goes against you and violates your stop level.
Let me show you a couple of charts that will help to illustrate my strategy. Apple (AAPL) is a great example:
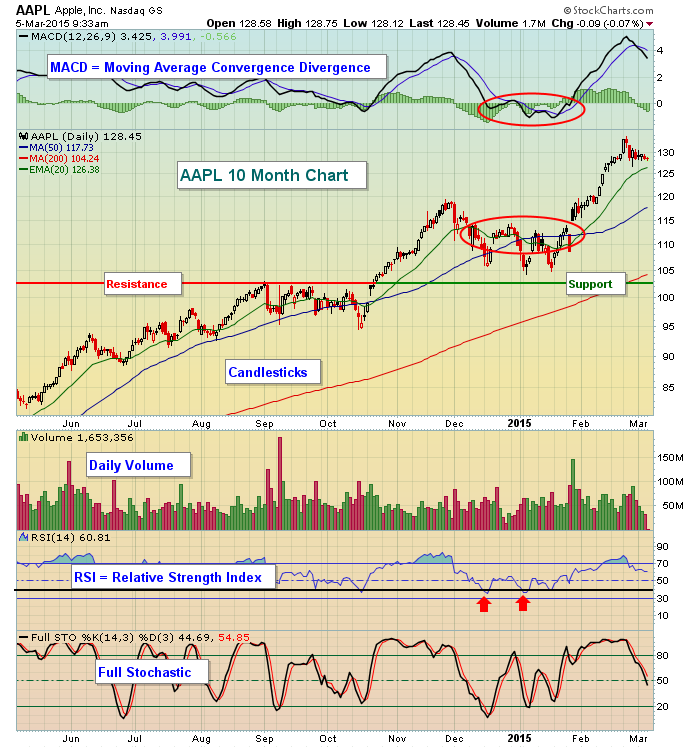
Note a few things here. First, the blue "call out" boxes are simply identifying the indicators I use and the fact that I prefer the use of candlesticks to chart the price action. Also, I've highlighted the "broken price resistance becomes price support" theory near the 103 level. But a key here is that many of my "secondary" indicators turned bearish while price support was never lost. The MACD moved beneath centerline support, which indicates that momentum had turned negative. A daily MACD reading below zero tells us that the short-term 12 day exponential moving average (EMA) has crossed beneath the long-term 26 day EMA. In addition, check out the "death cross" - 20 day EMA crosses below 50 day SMA. (I have a personal preference using the EMA for short-term moving averages and SMA for longer-term moving averages. I'll explain that another day.) All of this "bearish" action takes place in December and January. Despite these bearish signals, AAPL rallies close to 25% in a month. Did our technical indicators fail us? Remember, my primary technical indicator is the combination of price/volume. Did we ever lose price support? No. As long as price support holds, I'd remain with the primary trend, which is up.
No matter what technical indicators you use, please understand what they mean, how they're calculated and why they work. I won't invest thousands of dollars in a trade simply because "that line is pointing up" or "this line crossed over that line".
(3) Market Makers
The whole notion of short-term trading for profit is that the stock market is inefficient in the short-term. In the long-term, a stock will move to a price level that's consistent with its fundamentals. If products are well received by the market, revenues and earnings per share grow and management executes its business plan, a company will see its stock price rise - unless the overall market is overpriced and we enter or are in the midst of a bear market. There are times when it's difficult or nearly impossible to swim against the current. But generally speaking, a company that's performing well fundamentally will be rewarded with a higher stock price over time.
In the short-term, however, industry groups that are strong sometimes move out of favor temporarily as rotation in a bull market evolves. Individual companies that perform well fundamentally can go through short-term periods (days or weeks) of market weakness, creating high reward to risk opportunities. Much of this relates to our market maker system, where we have liquidity providers (market makers) taking positions in stocks during periods of trade imbalances - buys vs. sells. If there's an imbalance on the buy side, market makers will fill the orders by taking short positions. And the thing to understand about market makers is THEY DON'T LOSE MONEY. They will lose on trades and occasionally they'll have losing days, but the overwhelming majority of their trades result in profit. When a stock gaps higher because of news, it's the imbalance of buy orders vs. sell orders that causes the price to open higher. Because the majority of traders want to buy, market makers are on the sell side. Ever heard of "filling the gap"? You can thank our market maker system for that. Market makers commit capital on the short side and frustrate buyers, usually sending a stock price back to fill the gap or test the prior day's close. Many who buy at the open become frustrated with the subsequent move lower, sell their stock and that allows market makers to capture a profit on their short sale. This is a very simplistic example, but one that you can use to your advantage as a trader. Here's an illustration with Adobe Systems (ADBE):
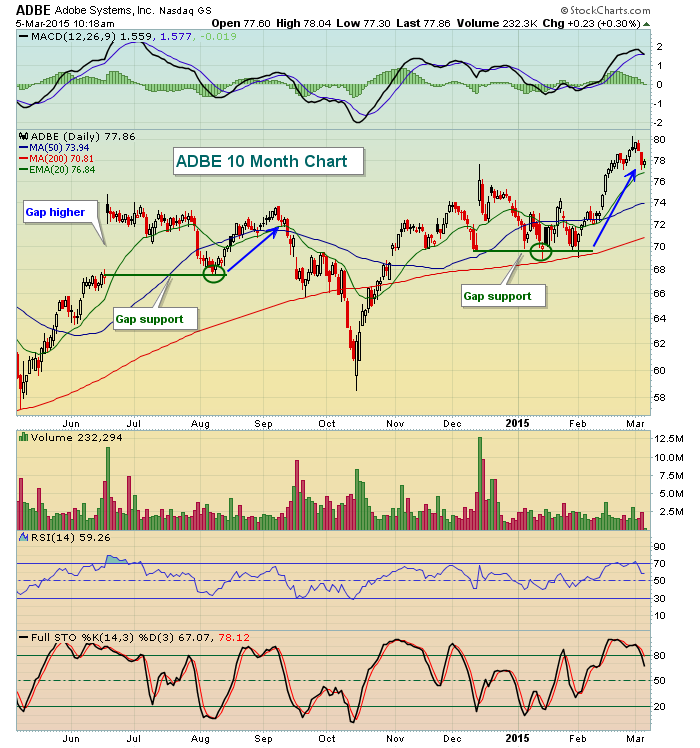
In both June and December, ADBE gapped higher on heavy volume after they reported their quarterly results. Those who bought their entire positions at the open had to suffer for several weeks as ADBE slowly fell back to test gap support. Once it was tested (green circles), however, prices magically began rising again. While it may look easy on the chart, trading gaps can require TONS of patience - something the most successful traders have plenty of. I'll discuss gaps in this blog on many future occasions as there are several different types of gaps and the strategies to effectively trade each vary.
(4) Earnings
I am constantly reviewing the basics of earnings reports. No, I no longer analyze the balance sheets, sales growth rates, cash on hand, etc. For me, it's all about beating Wall Street consensus estimates and getting a positive reaction from traders. This seems like a rather obvious answer, but think about this question. Would you rather own a company where management is executing its plan to perfection, blowing away both Wall Street consensus estimates and its competition....or would you rather own a company where management continues to provide excuses for why they fell short of their targets? Isn't the answer obvious? My favorite trades COMBINE the strongest fundamental companies with the best technical setups. I'll feature the technical attributes of many companies that fit this profile in my blog. You won't want to miss these.
One other thought about earnings. I don't like holding any stock into its earnings report. Many times, it's nothing more than a coin toss. If I'm trying to manage risk, the last thing I want to do is risk a lot of capital on a coin toss.
(5) Sector and Industry Group Rotation
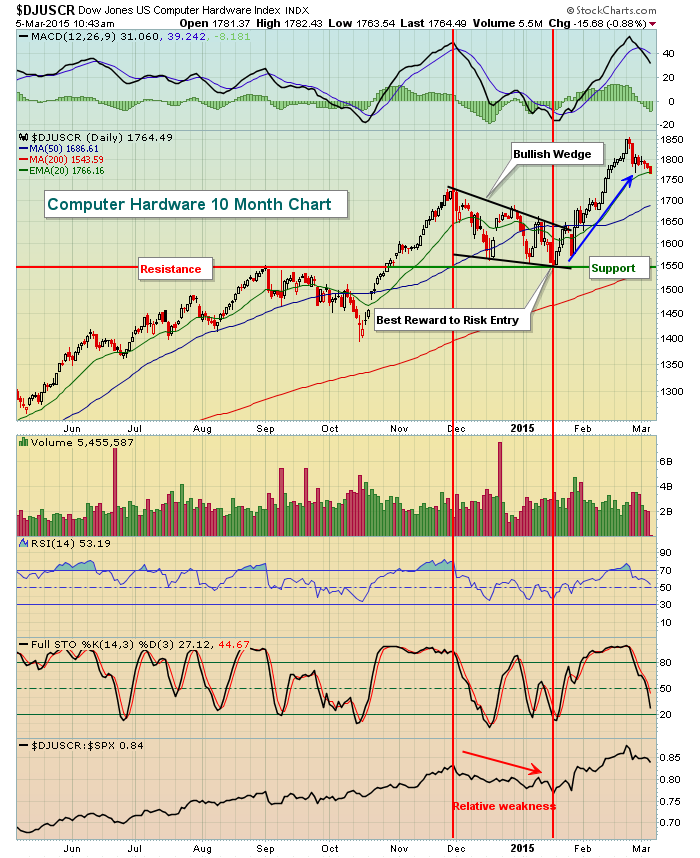
As I mentioned earlier, money rotates during bull markets. Not every sector, industry group and company move in unison. Many of the best opportunities to profit in the stock market can be found simply by searching for technically strong sectors or industry groups that show relative weakness in the short-term and hit or approach major price support. I've written about many of these situations in past ChartWatchers articles. One of the latest examples centered around the Computer Hardware index ($DJUSCR). In January I pointed out a bullish falling wedge that formed, sending the DJUSCR down to test key price support. Take a look what happened from there:
(6) Scanning
Once you identify the types of trades that interest you, you can literally scan the thousands of stocks on the various exchanges to find those that offer nice reward to risk opportunities and fit your trading style. I'll take the time here to occasionally demonstrate some of my favorite scans and methods for uncovering stocks that present great reward to risk opportunities.
To conclude, the goal of my blog will be to educate - both in terms of understanding technical analysis and using the tools at StockCharts to increase your chance of success with respect to trading.
If you want to catch all of my upcoming articles, click on the "Email Updates" link to the right of my blog and you'll be sent an email every time a new article is posted here. Enjoy and please send me comments periodically. I would love to hear your opinion, regardless of whether you agree with me or not. After all, a market is made up of two sides, right?
Happy trading!
- Tom Bowley


