Generally, I review my trading positions on a stock by stock basis. If I've hit my target on one, I try to be disciplined and take the profits - or at the very least partial profits. If my stop loss has been triggered, it's time to take the loss, lick my wounds and move on. Understand from the very beginning that not every trade will work. That's about the only guarantee I'll ever make when it comes to technical analysis. You won't win them all - I guarantee it! Occasionally, I may remove most or all of my positions based on outside influences, however. If the market has made a solid move to the upside and we're approaching a historically weak period of the year or the calendar month, I sometimes will sell positions to raise cash and lower risk. There's always another trade to be made somewhere so I try not to worry about the "what if the stock market keeps going higher". Market action is constantly rotating and opportunities will present themselves elsewhere. If you haven't already, please go back and read my blog article "Can You Time The Stock Market?". It's an interesting historical look at how the S&P 500 has performed throughout the calendar month over the past 65 years and reveals staggering bullish and bearish revelations during the month. So if our major indices become overbought or flash negative divergences on the MACD during or as we're entering one of the bearish historical periods, I may determine it's time to lessen my exposure on individual stocks even though they remain technically sound. Usually it simply comes down to how much risk I'm willing to take.
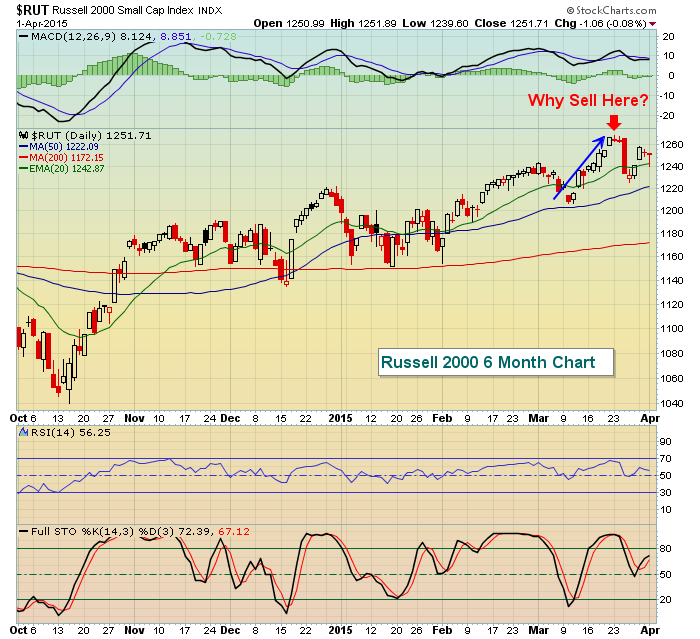
Let's now revisit the question I posed in yesterday's blog article. Here's the chart I presented on the Russell 2000 ($RUT):
For purposes of this article, I'm going to stick with only the technical indications and overlays that I use on my charts. There are dozens and dozens of other indicators that could be reflected here and those may or may not support a sell decision. As I always say, if you have a set of indicators or overlays that work for you, don't change a thing. Trading is quite subjective and everyone should work towards finding the indicators and overlays that fit your unique trading strategy and style and works for you.
There are a few reasons here why you might sell based on historical trends and technical indications. From strictly a historical perspective, the 23rd of the calendar month falls right square in the middle of the bearish 19th to 27th part of the calendar month. Since 1988, the Russell 2000 has produced a NEGATIVE annualized return of 2.12% from the 19th to the 27th of the calendar month. Therefore, historical tendencies would tell us to at least be aware of the trend when considering the risk you're willing to take. Also, looking at the chart, you can see that stochastic was near 100 and RSI was approaching 70 so the index was fairly overbought in the short-term. But from a short-term trading perspective, the intraday 60 minute chart was the real killer. Have a look:
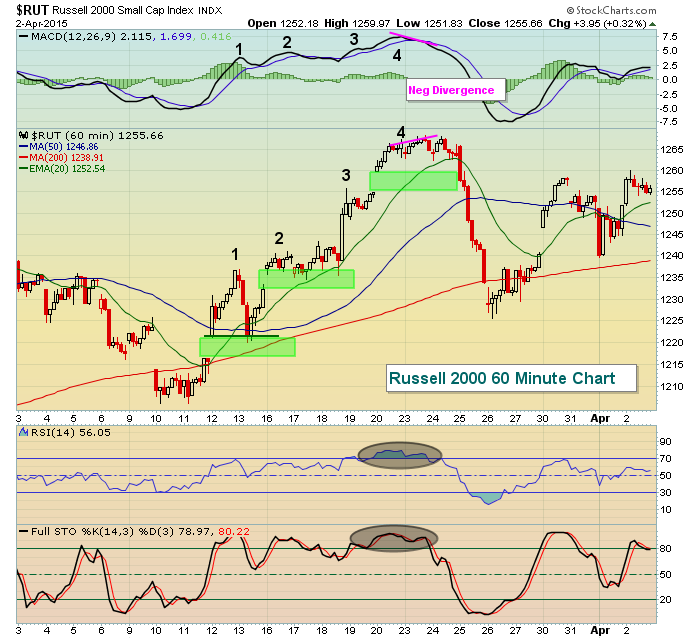
Over a two week period starting on March 10th, the Russell 2000 rallied and there were four times (each numbered above) it broke out with momentum (MACD) supporting the rally. But note as prices attempted to move higher on the 23rd and 24th, the MACD stalled and actually began rolling over. As I've stated before and I'll continue to state over and over again, this guarantees us nothing. The Russell 2000 could have rallied sharply from here as the stock market can do anything it wants. I NEVER look to my technical indications to provide me a guarantee. I use technical analysis to MANAGE RISK. Read those two lines time and time again. We're not searching for guarantees because there aren't any. We are managing risk, it's that simple. In the example above, the Russell 2000 had advanced more than 5% in two weeks! That two week performance had outperformed 12 of the previous 27 years ANNUAL performance on the Russell 2000. How greedy can we be? We're traders, remember? It's amazing how we start off as traders, but after watching positions rise for a couple weeks, the emotional side of each of us likes to take over.
If my blog articles prove helpful, I truly hope it's my focus on managing risk - not taking any undue risks and occasionally stepping off the gas pedal when conditions dictate.
I have one final thought on selling and this one is a staple for me. I always sell before earnings. I know many of you like the potential huge scores that come with holding stocks into their earnings reports. It's a big adrenaline rush. But if you're truly concerned about managing risk, how could you risk thousands of dollars on a coin toss? There are options strategies of course that can be used to manage risk somewhat, but I'm talking about just buying or holding a stock into earnings and rolling the dice. In a rising market, I suppose if you hold enough stocks the law of averages will support the notion of holding. But I personally can't stomach waking up to big losses. The law of averages never seemed to work for me. :-)
There are plenty of examples that could be used to either support the notion of holding into earnings or advising against it. Here's just one example (BABA) of what I do not want to wake up to during earnings season:
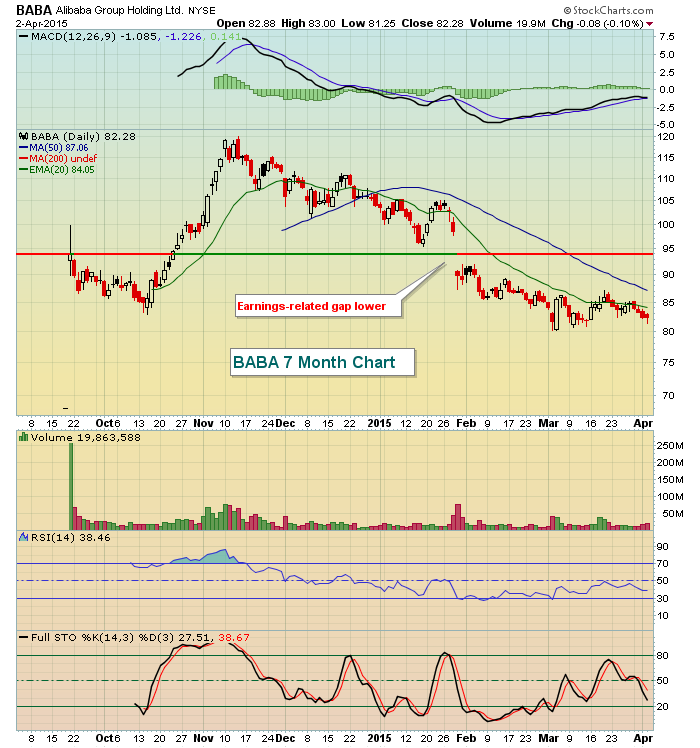
There are always two sides of a story. One could argue that the mid-90s represented solid price support on BABA and that earnings would begin the next uptrend. A bearish argument could center on the three month downtrend and the MACD below its centerline. Either way, holding BABA into its earnings is nothing more than a gamble in my opinion. That is not managing risk, it's taking on more. No thanks.
Happy trading!
Tom
