Wow, this is a loaded question and it will take a few articles to try to address it. For every bear market, we seem to have a different reason. Since the turn of the century, we've seen two significant bear markets - one that gripped the market from 2000 through 2002 and another brutal one that began in 2007 and thankfully ended in 2009. The former has been referred to as the "tech bubble" where it seemed any company with a ".com" justified a multi-billion dollar market cap. We didn't care whether these companies ever posted earnings, we just wanted to see another stock split, remember? Overnight gains in many technology stocks were simply stunning. And as we look back, many of us now realize we got caught up in all the hype and paid a painful price for it. The second bear market that began in 2007 came as a result of easy credit that led to a subprime mortgage disaster, housing collapse and nearly triggered a financial system meltdown. Yes, it was scary.
But now we have stock markets at or near all-time highs once again and the overwhelming #1 question that is asked over and over again - WHEN SHOULD I GET OUT?
First, it's important to mention that everyone has different financial goals and different investing/trading styles. So I don't believe there's ever just one answer to this question. Someone who is managing a college fund for a child that starts school in a couple years may have a completely different outlook than someone who is managing a retirement account that won't be touched for 20-30 years. Some of you are traders, looking to provide additional short-term income while others look to buy and hold to reap the benefits of well-managed companies while keeping the tax bill low. Therefore, it's impossible to write an article that will sufficiently answer this question for everyone. From my perspective, however, as a short-term swing trader, I have a fairly short list of how I evaluate the health of the stock market and when it's time to grow more cautious. There are a few tell-tale signs that make me nervous and I'll give them to you one at a time. For today, let's focus on a big one.
Drum roll please.
1. A DOWNTREND BEGINS
Duh. Okay, this one is obvious right? Probably, but if a bull market is a series of higher highs and higher lows, then a bear market must begin with the opposite. The problem is that with every down day in the market, a wave of bears show up tooting their horns again. One day doesn't make a trend. Last Friday was a perfect example. Yes, it was a big down day out of the blue and it inflicted some damage into many portfolios but look at it from a very short-term view and then from a big picture view and see if you can tell the difference:
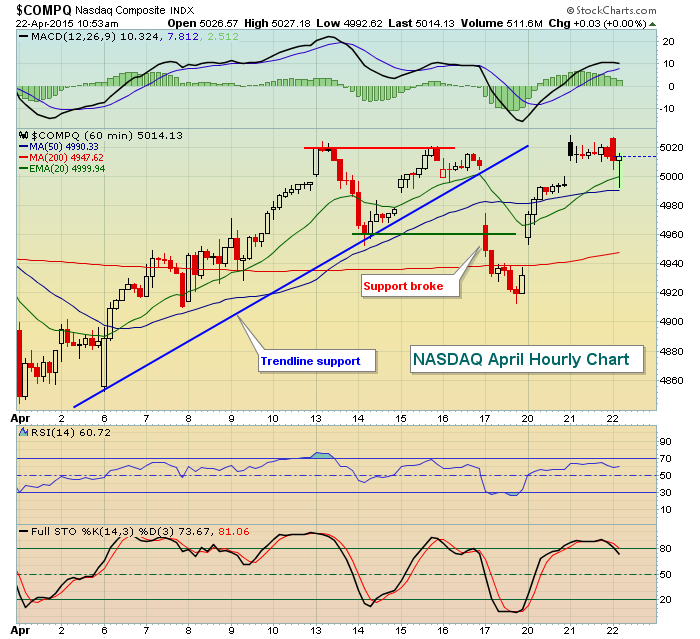
There's an uptrend in place and a double top formed on April 13 and April 15. Then the low between those two highs was lost on April 17, last Friday. So the trendline was broken, then price support lost. Is this the start of a bear market? Well, bear markets don't signal a beginning just because support is lost on an intraday chart. There's much more to it than that. We need to look at a much broader view of the stock market. Let's take a look at a long-term weekly chart and see how much damage Friday's selloff inflicted:
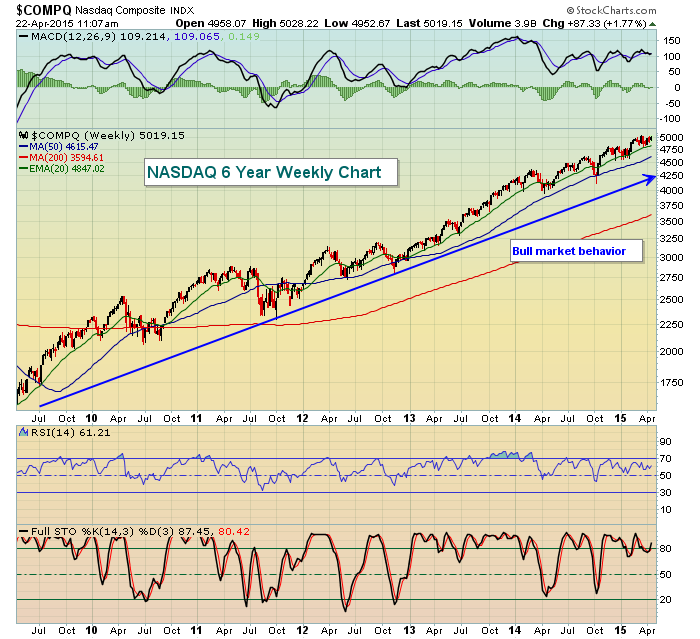
Notice how what seemed like a big loss last Friday just gets lost when you look at the big picture? It gets swallowed up in the overall action and has little impact whatsoever. This is what I refer to as Mind over Chatter. Pay attention to what the charts are telling you and less about what the talking heads on CNBC are saying and you'll be much better off. This shows us what we DON'T have to worry about on the long-term chart. What DO we have to worry about in terms of long-term price action? Well, let's take a look at what a long-term price breakdown looks like:
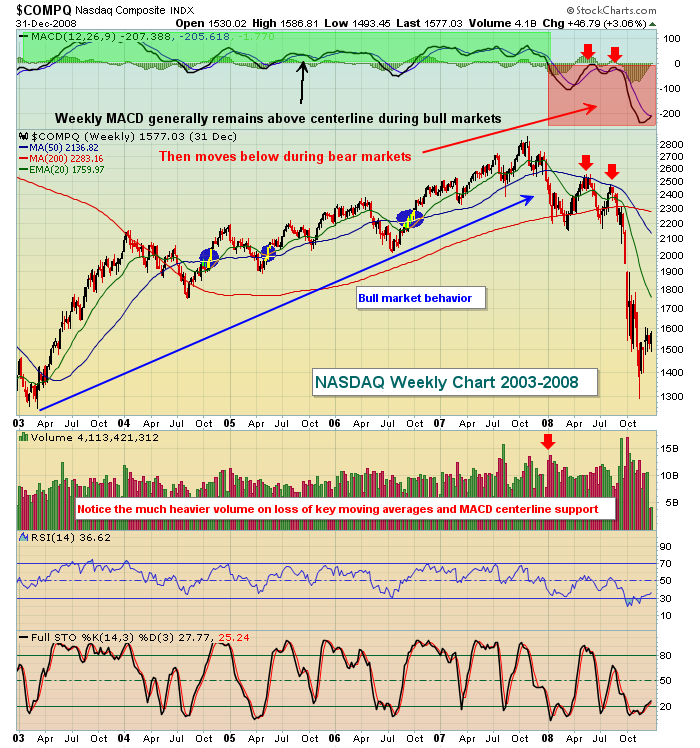
The biggest changes of note as a bear market begins are as follows: (1) MACD fails to recover back above centerline resistance on move below which reflects changing momentum, (2) stock prices fail to climb back above critical moving averages (check out the blue circles on prior recoveries), and (3) the biggest of all - high volume accompanies breakdowns indicative of distribution. Unlike earlier in this article, this breakdown was not of the short-term variety. This was a breakdown of significance on a long-term chart and subsequent attempts at recovery (red arrows) failed miserably. If you fail to act on the initial breakdown, you should seriously consider doing so on the subsequent failure at a rally as the bull market is nothing but a SHADOW of itself at this point.
Much of the rest of this series will focus on intermarket relationships and how the dynamics of market rotation can clue us in as to possible turbulence ahead, BEFORE the selling actually begins. If you have thoughts or ideas as to what intermarket relationships might impact the future of price action, let me know in the comments section. I'd love to hear from you. Also, if you want to make sure you're receiving my blog articles as soon as they're published, be sure to subscribe by clicking on "E-mail updates", entering your e-mail address and clicking "Subscribe". It's that easy. Then all of my articles will be sent to you the moment they're published.
As always, happy trading!
Tom


