I generally spend a lot of time writing and talking about areas of the market showing strength. The reason? I'm a momentum trader and we're in the midst of a six year bull market. When I trade a stock, I typically would like to see immediate results. Sectors and industries that have been lagging for long periods of time make it much more difficult to find winning trades when time is of the essence. We do occasionally see "V" bottoms on charts, but I avoid looking for those because that pattern is unreliable and very risky. But sectors and industries do underperform for weeks or months as profit taking and consolidation take place within bullish continuation patterns. The Dow Jones U.S. Home Construction Index ($DJUSHB) was a perfect example, topping near 550 in May 2013 and trading in a bullish ascending triangle pattern for the next 21 months before finally breaking out again. At the low point in that triangle, the DJUSHB was down approximately 30% off its high despite the benchmark S&P 500 remaining flat during the same period. For that short period of time, home construction was the worst area of the market to have been in. But patience allowed the DJUSHB to print its continuation pattern and ultimately break out. It's now one of the strongest areas of the market.
Here's the chart:
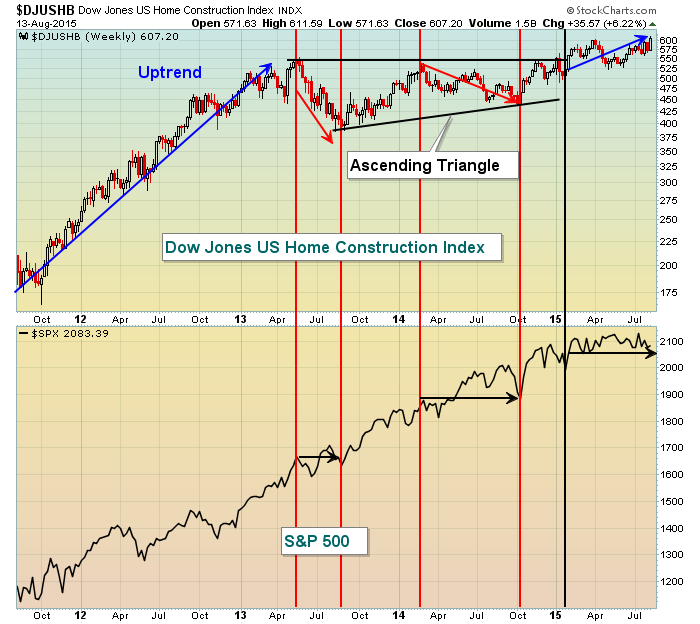
I've written often about home construction so I don't want to spend a lot of time here. But do you see how frustrating it would be to trade home construction stocks from May 2013 to February 2015? The S&P 500 was surging throughout much of that time while home construction stocks lagged badly. It's called rotation. Look at the parabolic rise in home construction stocks throughout 2012 and into the first quarter of 2013. They WAAAAAY outperformed the S&P 500 during their period of strength. You can't count on any sector or industry group to lead forever. They need a break as different economic cycles emerge during a bull market. Home construction took a break in the form of a bullish continuation pattern and has now resumed its leadership role.
So what other current industry groups are "hibernating" right now, potentially awaiting their turn in the sunshine? Well, to find them I started by looking at the worst performing industry groups over the past six months or year within the most aggressive sectors - consumer discretionary, technology, industrials and financials. There were many notable groups, including gambling stocks ($DJUSCA) which I've written about previously. So for purposes of this article, I'll skip the DJUSCA even though I do believe they're currently in a bottoming process. Based on my review of all underperforming industry groups within the aggressive sectors, here are two that I am watching closely as they potentially underperform their way to superb reward to risk opportunities:
Automobiles ($DJUSAU):
Over the past six months, there are only two industry groups within the consumer discretionary sector that have produced weaker returns - gambling ($DJUSCA) and business training & employment agencies ($DJUSBE). The DJUSAU is down more than 8% in the last six months and if we look back one year, the DJUSAU is down more than 11% and is surpassed in futility only by the gambling index. Clearly, this group fits the "underperforming" criteria. Technically, what looks promising here? Well, first keep in mind that I'm approaching this as though a bull market remains. If you don't believe that, then there's no point in considering the "rotation" concept. If you believe a bear market is at hand, there won't likely be too many winning industry groups and this whole exercise is pointless. But I've been around enough bull markets to know that most bears have predicted 20 of the last 2 bear markets. I don't see enough under the surface signals of a looming bear market and therefore need to see major price breakdowns to adjust my current strategy. To be honest, I'm more concerned about the seasonality headwinds facing the market than any other factor right now. It's a historical fact that August and September produce the worst consecutive calendar month results for U.S. equities since 1950. I don't want to ignore that. If multi-month lows do not hold on weakness and volume accelerates, we need to be very cautious. For now though, I'll assume support is going to hold and look for the areas where normal bull market rotation could benefit. That takes me to automobiles and here's the chart:
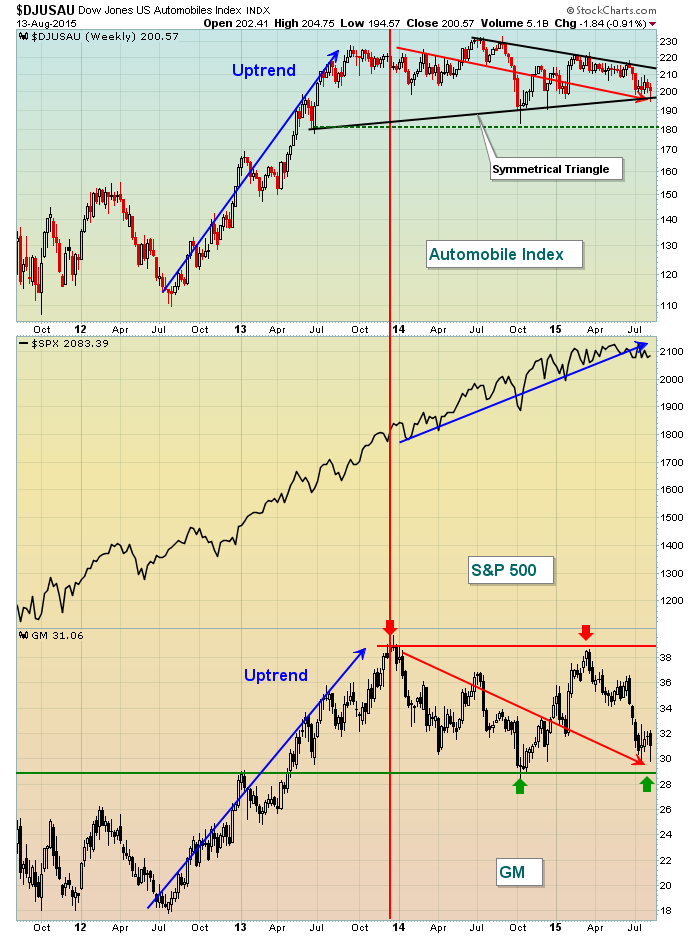
This is another example that shows how a group like automobiles can have a parabolic rise for a year or longer, then simply need a rest to consolidate those gains. For the past year and a half, automobiles have rested and are potentially testing the lower uptrend line in a bullish symmetrical triangle pattern. Worst case, watch price support on this index closer to 180, especially if the overall market weakens further during late August and September, which it so often does. At the bottom of the chart, you will see the primary culprit for the weakness - General Motors (GM). After more than doubling in price from mid-2012 through the end of 2014, GM has consolidated sideways for more than 18 months and is closing in on major price support at 28.00-29.00. It will be important technically for GM to hold this price support zone. Don't be shocked to see the resumption of strong relative performance in autos should the bull market resume.
Transportation Services ($DJUSTS):
Transportation services is showing a very bullish ascending triangle pattern, similar to what I showed above with the home construction index. While the temptation might be to just jump on board now, the truth is that continuation patterns are not confirmed until their breakout occurs. We could be mired in this consolidation pattern for several more weeks, or perhaps much longer. The chart could morph into a rectangular consolidation pattern where recent lows are tested again. While higher reward to risk entry could be considered now based on the potential measurement of an ascending triangle breakout, the primary risk of doing so is obvious - that a breakout of this pattern never occurs and/or that a different continuation pattern takes shape. Take a look at the current technical picture of the DJUSTS:
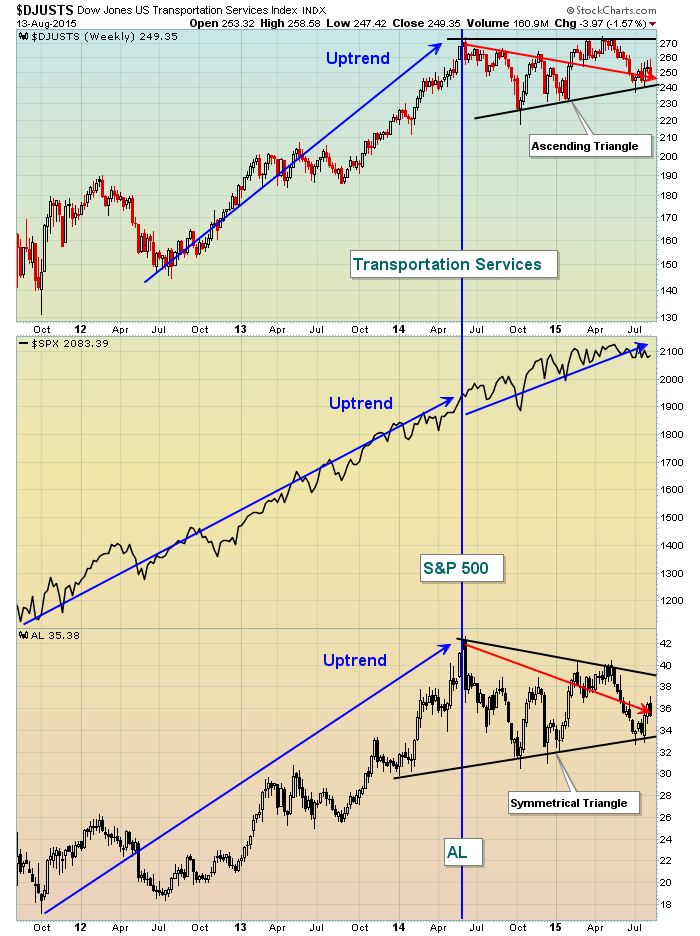
Similar to automobiles and home construction, you can see that transportation services significantly outperformed the S&P 500 for a long period of time, from mid-2012 to late-2013. Since that time, it's most likely been frustrating if you've traded stocks within this space as money has rotated away from this industry group. Until that money flow returns, many of the transportation services stocks will languish. At the bottom of the chart, Air Lease (AL) has become a bright spot, recently reversing its downtrend just as it tested the bottom uptrend line in a symmetrical triangle pattern. AL just recently reported better than expected quarterly revenues and EPS and that could be the jump start this stock and industry needs to regenerate buying interest.
From a seasonality perspective, both automobiles and transportation services have historically struggled during the months of August and September, but transportation services show significant seasonal strength during the months of October and November. Check this out:
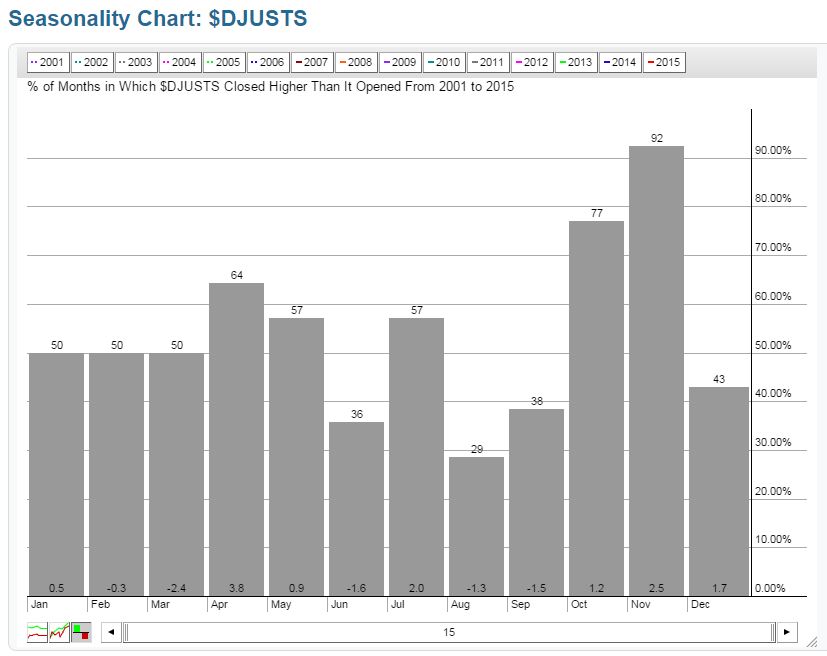
Those "twin towers" in October and November suggest the fourth quarter has been very kind to this industry group over the past 15 years. Given the bullish technical backdrop, this is very important knowledge to have.
In my "Trading Places LIVE" webinar at noon EST today, I will cover the above industry groups and several more industry groups that have been lagging for the past six months to a year to determine what's needed for them to regain leadership roles. Of course, I'll also cover the current state of the market - the major indices and sectors - before taking your individual questions during "Free For All Friday". To register for this FREE webinar, CLICK HERE. Hope to see you there!
As a reminder, you can "subscribe" to my blog articles by typing your email address to the right of my article under "Subscribe to this blog". Click on "Email updates" and provide your email address, hit "Subscribe" and all of my articles will be sent directly to you as soon as they're published!
Enjoy your weekend and happy trading!
Tom
