Market Recap for Thursday, December 17, 2015
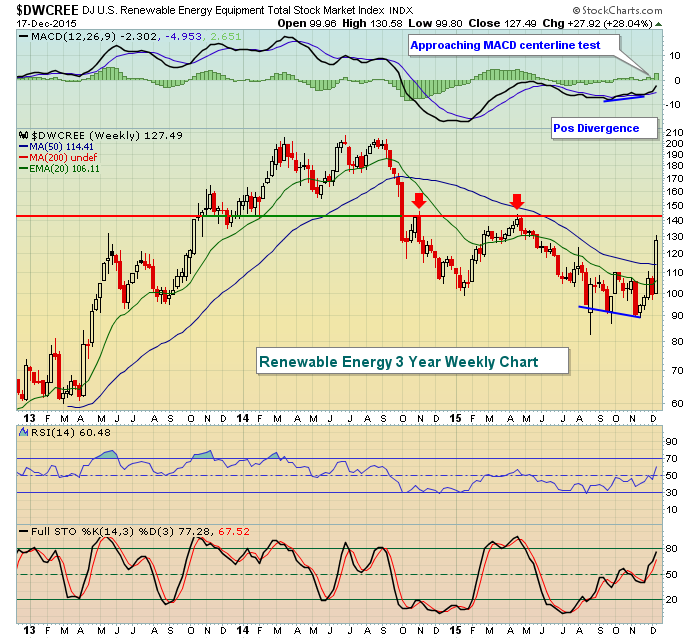
Traders seemed overjoyed to finally put the uncertainty of higher interest rates behind them on Wednesday....only to find new worries on Thursday. After attempting to rally the past few days, crude oil ($WTIC) fell again on Thursday to close near 36.00 per barrel. That continued to add selling pressure to an energy sector (XLE) that can't find much relief. The XLE lost 2.46% yesterday and has now fallen more than 10% over the past month despite one of its industry groups - renewable energy ($DWCREE) - gaining an astounding 41% over that same one month period.
A positive divergence on DWCREE's weekly chart led to the recent break above its 50 day SMA. Now there's significant price resistance near 140 with the 50 day SMA serving as short-term support. Here's the chart:
The problem with energy lately definitely has little to do with renewable energy. Four of its six industry groups have declined 10% or more over the past month with pipelines ($DJUSPL) down a staggering 28% in just the last month. Other than being very oversold, there's little to like about this group technically.
Utilities was the only sector that rose on Thursday with healthcare (XLV) and consumer staples (XLP) - the other two defensive sectors - down the least among the eight remaining sectors. Outperformance by defensive groups on overall market weakness isn't generally a concern of mine, but it followed strength in defensive groups on Wednesday when the market was strong. So while there's been no serious price breakdown recently in my view, I am seeing deterioration in the "beneath the surface" signals that I follow closely.
Pre-Market Action
There's been some volatility this morning with U.S. futures primarily in negative territory. They're well off their worst levels of the morning, however, as traders look to again reverse the short-term action, which yesterday was negative. European markets are down across the board, following bearish action in Asia overnight. Perhaps most important is the 10 year treasury yield ($TNX), which has fallen to 2.20% at last check. This suggests traders remain in cautious mode, not the best environment for equities.
Current Outlook
Back and forth price movement has dominated the action during the recent correction and subsequent recovery. I want to take a step back and look at the long-term weekly chart of the S&P 500 throughout the current bull market. I'm also going to focus on the long-term weekly RSI signals that can be used to determine whether the bull market remains intact. Take a look:
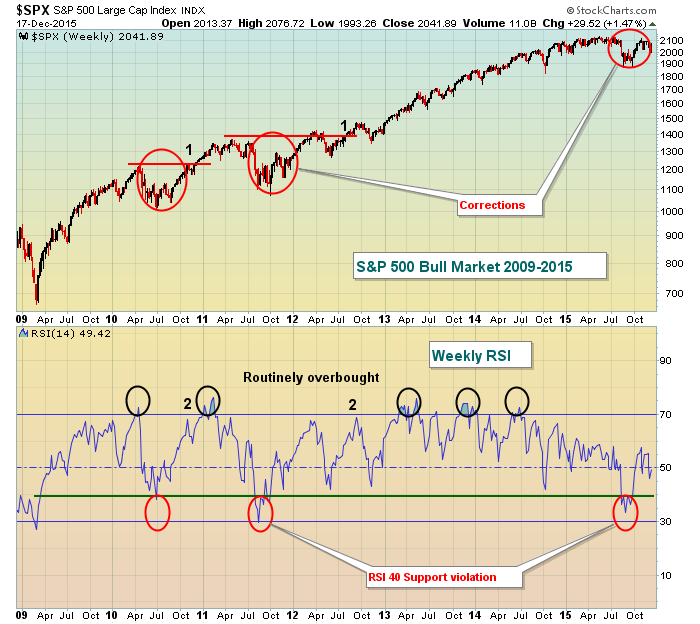
During bull markets, the weekly RSI generally holds 40 support. That's a key support and violation of it stems from either a correction or transition to a bear market. I've shown points 1 and 2 in black numbers to identify what I look for in terms of sustaining the ongoing bull market. We need to see previous closing highs cleared and we need to see the RSI move back above 60 resistance. Currently, we've seen neither so RSI has yet to confirm whether current action is simply a correction or perhaps the beginning of a bear market.
For comparison purposes, take a look at how the RSI reacted during the bear market from 2007-2009:
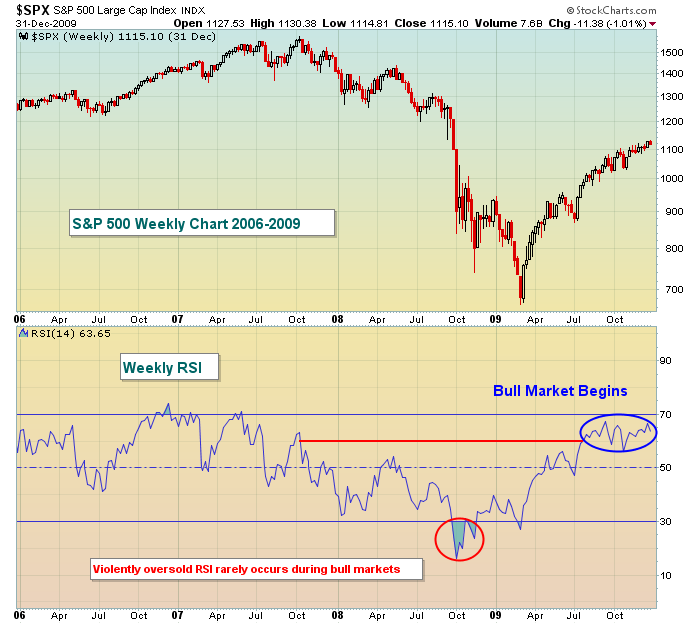
During bear markets, it's unusual to see weekly RSI move back above 60 resistance as the bulls cannot regain enough control of the action long enough for the RSI to breach that level.
Sector/Industry Watch
Consumer discretionary (XLY) has been under considerable selling pressure lately, especially relative to its consumer staples counterparts (XLP). One area of discretionary, however, has remained fairly strong and is in a bullish pattern currently. Thursday's decline of 1% in restaurants & bars ($DJUSRU) could provide an opportunity in the near-term if bullish historical conditions kick in through year end. Check it out:
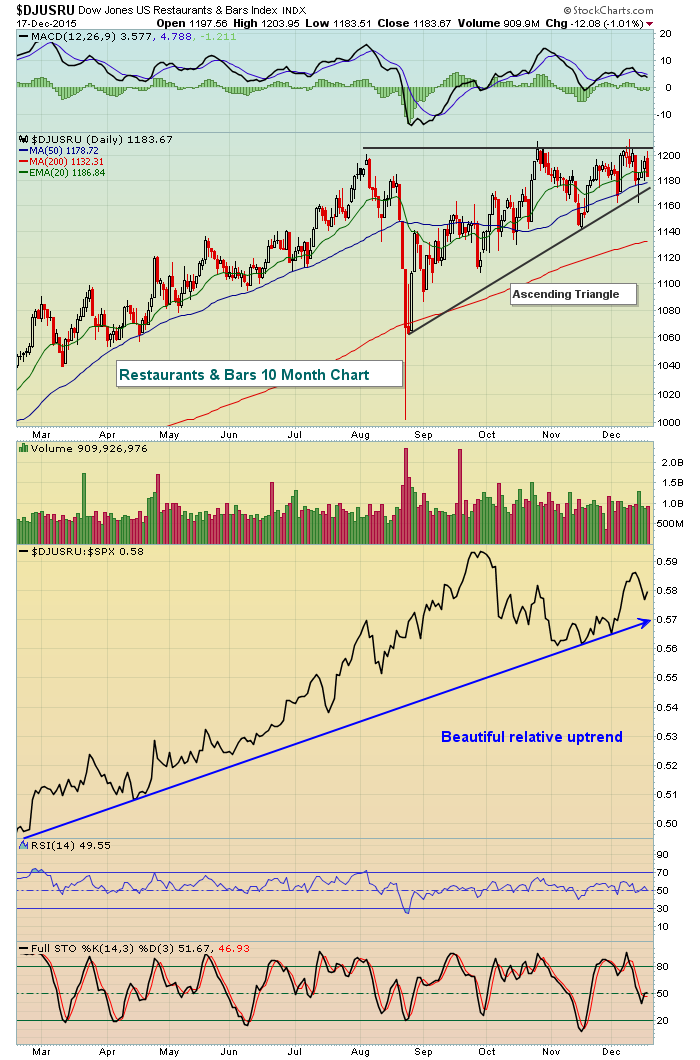
Given the bullish pattern, I'd look for the next significant move to be higher and ultimately to see another breakout.
Historical Tendencies
Remember that the current period period from December 16 to December 31 becomes even more bullish historically from December 21 to December 31. This represents the strongest part of the period and Monday marks December 21.
Key Earnings Reports
(actual vs. estimate):
BBRY: (.06) vs (.20)
CCL: 41 (estimate - haven't seen actual results as of time of this report)
DRI: .54 vs .42
KMX: .63 vs .68
LEN: 1.21 vs 1.12
Key Economic Reports
December PMI services to be released at 9:45am EST: 56.1 (estimate)
Happy trading!
Tom
