Market Recap for Thursday, February 18, 2016
The keys to the sustainability of the recent rally will be twofold: (1) will there be enough buying pressure to clear key resistance levels as they're approached and tested? and (2) will there be enough rotation to aggressive areas of the market to confirm breakout attempts? Yesterday, energy (XLE) became our first casualty under key #1. After opening just above the 58.00 level to attempt to clear its recent trading range, reality set in and the XLE printed a reversing dark cloud cover candle off its uptrend. The 1.25% drop wasn't huge, but it was a tiny example and reminder of what bulls will face in the trading days ahead. Here's the visual:
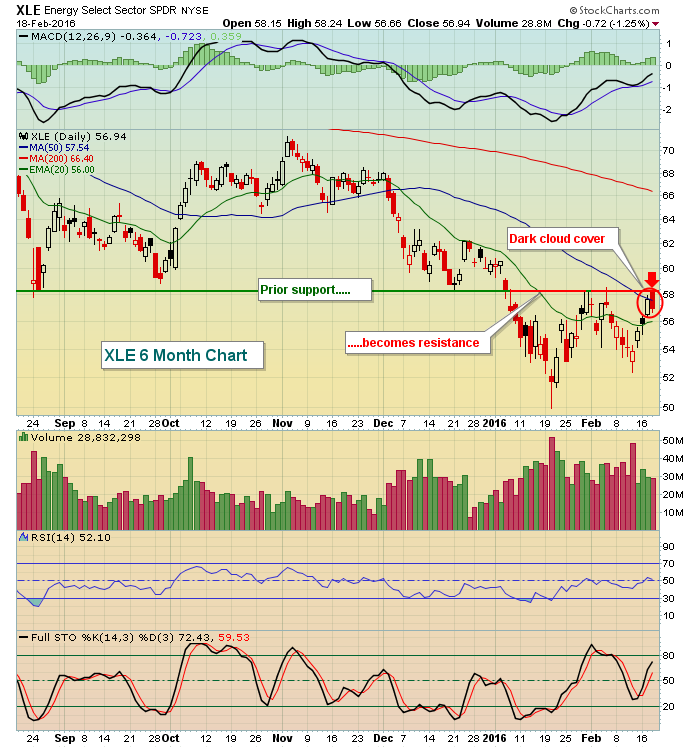 This chart is really quite educational. TA 101 starts with "broken support becomes resistance" and candlesticks are useful in identifying potential reversals. Note the word "potential" because technical analysis does not provide guarantees. For me, technical analysis helps me to manage risk. The XLE was in a prior trading range from 50.00-58.00. The open on Thursday tested the upper end of this range and the reversing candlestick tells me to take profits if I'm trading the XLE. Could it go higher from here? Of course. But the risk, in my opinion, is now to the downside so why not capture profits and await a better, higher reward to risk, entry? There's certainly an argument to even short the XLE from this level because a breakout above Thursday's high would be the signal to cover with a minimal loss. Managing risk is the key, not being right 100% of the time.
Also of note on Thursday was the underperformance of the riskier consumer discretionary (XLY) space vs. consumer staples (XLP). After four days of outperformance, this relative ratio fell yesterday. It'll be interesting to see if money returns to discretionary stocks on a relative basis today as that will provide a much better chance of extending the recent rally. As the S&P 500 has fallen, you can see that the XLY:XLP has tumbled as well, sending traders into safety to prepare for the likelihood of a further equity decline. Check this out:
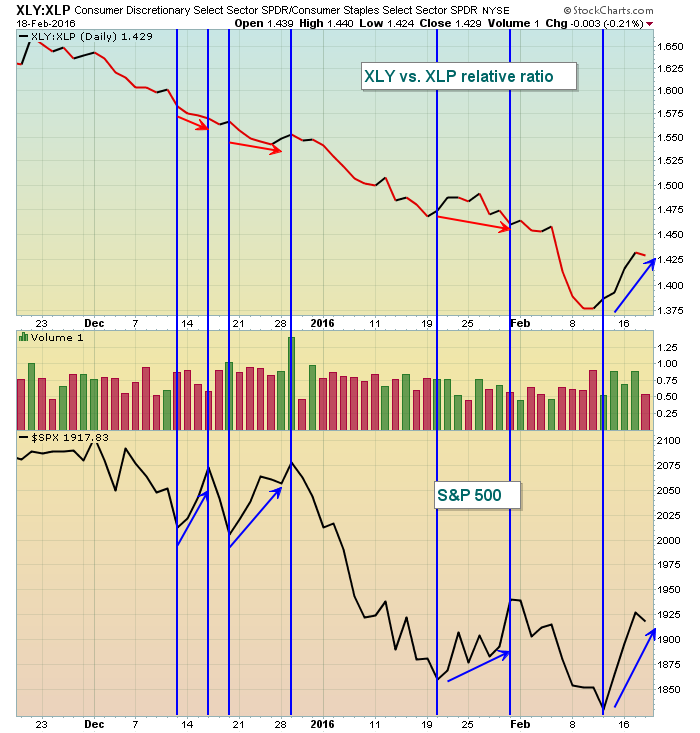 Check out the attempts at rallies on the S&P 500 over the past three months. Do you notice the different "mentality" of traders during this most recent S&P 500 rally? During prior S&P 500 rally attempts, money has rotated towards the XLP (think safety) and the rallies have failed miserably. This latest rally, however, has been powered by the reemergence of aggression into the XLY. These are the types of rallies that can last. And as I've posted in recent morning blog articles, there are positive divergences everywhere that suggested the selling momentum was slowing. This combination has powered the S&P 500 to a very impressive three day rally - prior to yesterday's selling.
Pre-Market Action
Futures are weak, although not horribly so. We're growing numb to large opening losses. Therefore, this morning's S&P 500 retreat of roughly six points pales in comparison. Short-term technical conditions are much more favorable currently and that does give bulls hope of a reversal today and continuing rally. Whether that materialized is another thing altogether and I address a couple key technical levels to watch in the Current Outlook section below.
Overnight, Asian markets were weak led by the Nikkei's 1.42% decline. This morning, that weakness has carried over to Europe where losses currently range from 0.45% to 0.65% in major markets there.
With little earnings or economic news due out today, trading will hinge mostly on options expiration and current technical indications, most of which remain positive despite yesterday's selling and this morning's early weakness in U.S. futures.
Current Outlook
We're currently in a market where bear market behavior is prevalent. Therefore, we should have the utmost respect for the downtrend in place off the December high and be prepared for a sudden downward bias. First, the Volatility Index is closing in on a level where renewed selling could begin. During prior bear markets, the VIX has moved down to the 16-17 level and we've still remained mired in a bear market. So understand that further market strength resulting in the VIX falling down into that zone is possible. But that 16-17 level is not a guarantee. In fact, most counter trend rallies end long before the VIX falls into that 16-17 zone. Here's a current look at the VIX:
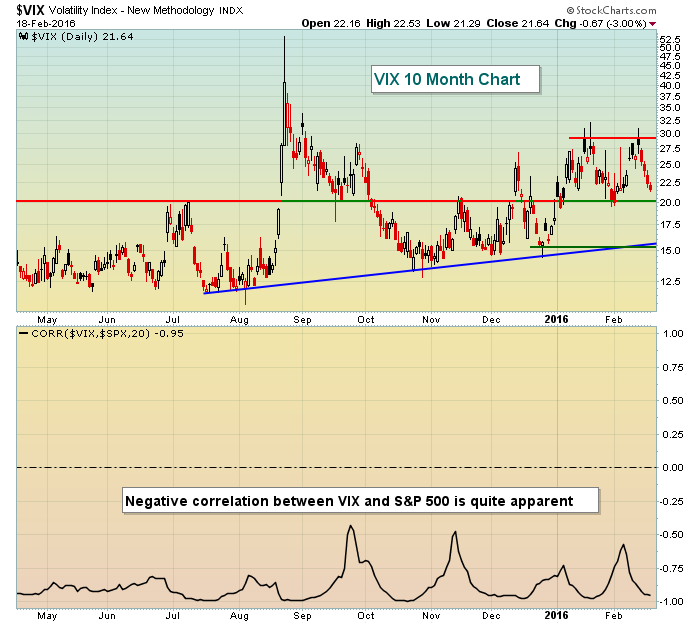 Always remember the VIX and S&P 500 move in opposite directions. Also know that the VIX tends to respond to key technical price levels, as opposed to overlays like moving averages and other technical indicators. Why? Because the VIX spikes, then retreats, spikes, then retreats. It responds to the emotions of the stock market. It does not trend for long periods of time like stocks. Therefore, many of the basic technical analysis techniques don't work with the VIX. The keys for me are the short-term trendline dating back to August, but especially the recent price low near 16. I don't believe that support level will be violated for quite some time. Furthermore, there's been a critical pivot area of late near 20. I expect we'll see a turnaround in the VIX near 20 on further market strength. That would be one piece of the puzzle that would suggest to me it's time to begin building short positions.
I'd keep a very close eye on the intraday charts for clues of a renewed downtrend. The 60 minute charts are what I use and I fully expect during a counter trend rally for the 20 hour EMA to hold as support. If that's violated, especially if other warning signs are present, I make no excuses on the long side. I take profits and exit stage left. Here's the current look at the 60 minute chart of the NASDAQ, which is an aggressive index and the area of the market that suffered the biggest loss on Thursday:
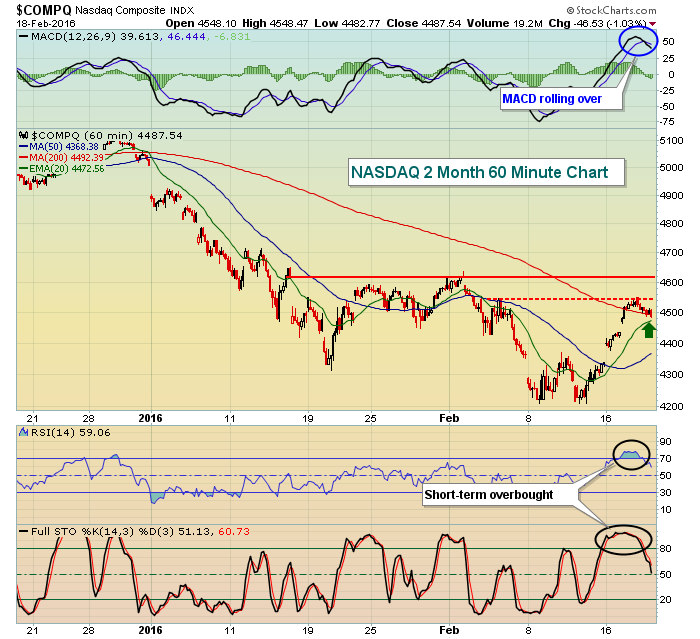 Here are a few key technical comments on this chart. First, the recent rally led to overbought conditions in the very near-term and yesterday's selling was not technically significant. We simply relieved those overbought conditions. Second, the daily MACD rolled over and we now have the possibility of a negative divergence emerging on our next rally to new highs - if another rally does in fact emerge. Third, there is both gap and price resistance near 4615 so that's a price level from which a reversal would be more likely. Four, the red dotted line connects more recent highs near 4550. If the NASDAQ can clear that level, then a test of 4615 becomes more likely, even probable. Finally, if this rally attempt fails at 4615, I fully expect another leg lower to initially test the low near 4200. How sector rotation develops during this scenario will me formulate an opinion as to the likelihood of a further decline. That call is too early to make at this point, although I do favor an ultimate breakdown to new lows given current conditions.
Sector/Industry Watch
The Dow Jones U.S. Defense Index ($DJUSDN) has been an excellent performer over the long-term. Short-term, however, it faces technical headwinds as recent price resistance and its downtrend line both are being tested from underneath. Take a look at a two year chart and the current triangle formation:
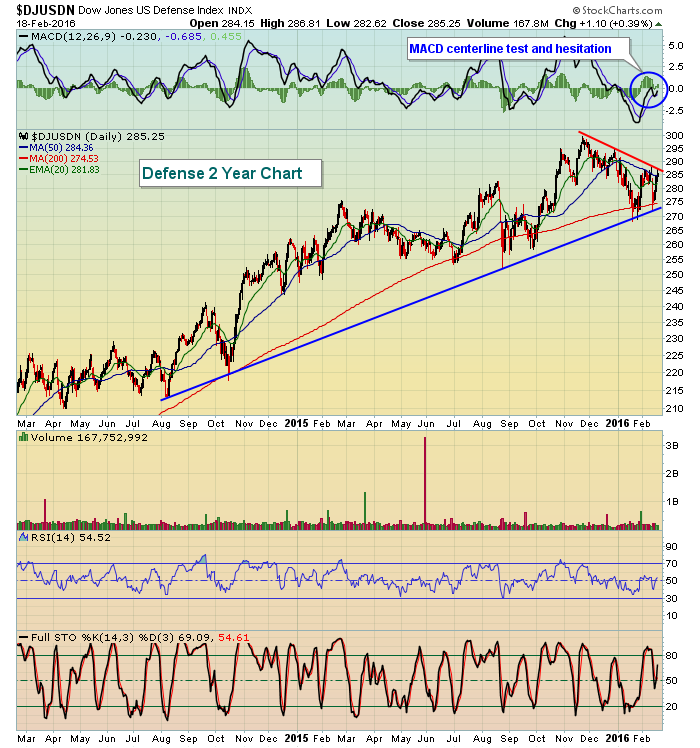 The long-term uptrend (blue line) has not been violated while the short-term downtrend (red line) is rather obvious. The MACD is stuck and hesitating near its centerline and the definition of a MACD centerline test is that there is no momentum on either side. In other words, the market is awaiting the next move in this index. There are a lot of areas that have broken down and are "shortable" on this rally. Defense is not one of them, in my view, because the longer-term bullish trend remains intact. I'd need to see the breakdown first.
Historical Tendencies
Today is the 19th day of the calendar month. I've reported on multiple occasions in the past that the 19th calendar day is the worst performing day on the S&P 500 since 1950. The annualized return is -34.10% with the 9th calendar day a distant second place finisher (-19.18%). Please keep this in perspective, however. The tendency is for negative action on the 19th, not a guarantee. In fact, since 1950, there have been 260 up days on the 19th and 285 down days. So the odds of a down day on the 19th is only a bit more than 50% - certainly not a lock. But the annualized return of -34.10% is a far cry from the normalized average annual returns on the S&P 500 of roughly 9%.
Key Earnings Reports
(actual vs. estimate):
DE: .80 vs .71
PEG: .50 vs .48
VFC: .95 vs 1.02
Key Economic Reports
January CPI released at 8:30am EST: +0.0% (actual) vs. -0.1% (estimate)
January Core CPI released at 8:30am EST: +0.3% (actual) vs. +0.1% (estimate)
Happy trading!
Tom
