Market Recap for Thursday, March 17, 2016
All of our major indices continued their five week advance with one notable exception - the NASDAQ 100 ($NDX), which fell slightly despite strong gains elsewhere. In particular, healthcare stocks (XLV) were weak with the XLV the only sector in negative territory, falling 1.16%. All five industry groups were down in healthcare, with the health care providers space the weakest of all, tumbling 1.45% on the session. All is not lost, however, as you can see from the chart below:
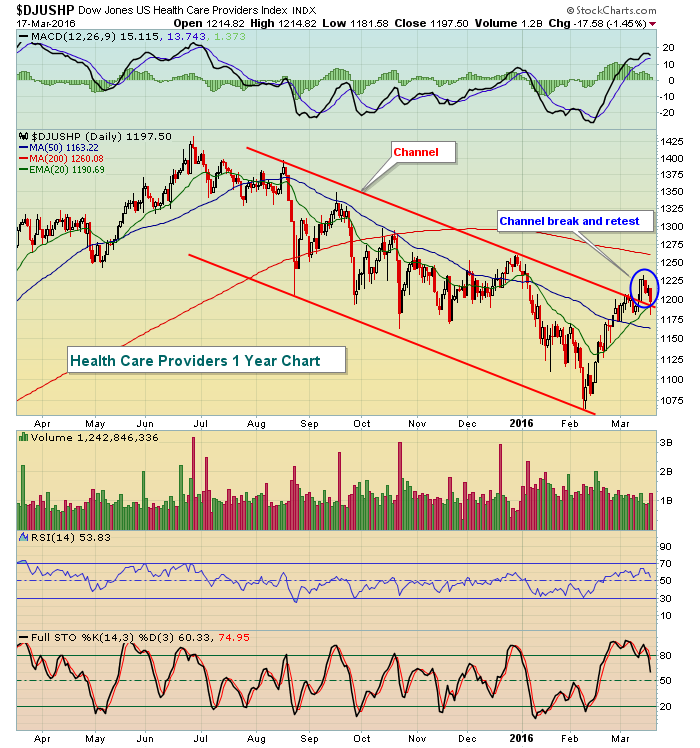 The DJUSHP broke its downtrend channel and has pulled back to test the breakout level and its rising 20 day EMA. Another positive in healthcare has been the recent performance of medical supplies ($DJUSMS). That group recently broke out to an all-time high and also tested its rising 20 day EMA on Thursday's selling.
There was much strength on Thursday, though, fueling the rally. Industrials (XLI), materials (XLB) and energy (XLE) rose 2.19%, 1.84% and 1.37%, respectively, to lead the bulls' rally.
Pre-Market Action
Today could be volatile with many asset classes expiring on quad witching day. Thus far, futures are up modestly. The 10 year treasury yield ($TNX) continues to hover just below 1.90% while a much more bullish development for equities would be for the TNX to climb decisively back above 2.00%. That would be further indication that the bond market believes are economy will strengthen later this year. So far, it's not sending that message and that's a concern.
Asian markets were mixed overnight. Tokyo's Nikkei ($NIKK) fell while both the China Shanghai ($SSEC) and Hong Kong Hang Seng ($HSI) rallied. In Europe, most indices are trading with fractional gains.
Current Outlook
Today marks "quad witching" day, which occurs four times every calendar year - the third Friday in March, June, September and December. Quad witching refers to a day in which we see expiration of various stock index futures, stock index options, stock options, and single stock futures. My experience has been that when the stock market has been trending in one direction, quad witching can turn the tables for a brief period of time so it's not unusual to see reversals. The following charts on the S&P 500 illustrates the past effects of quad witching:
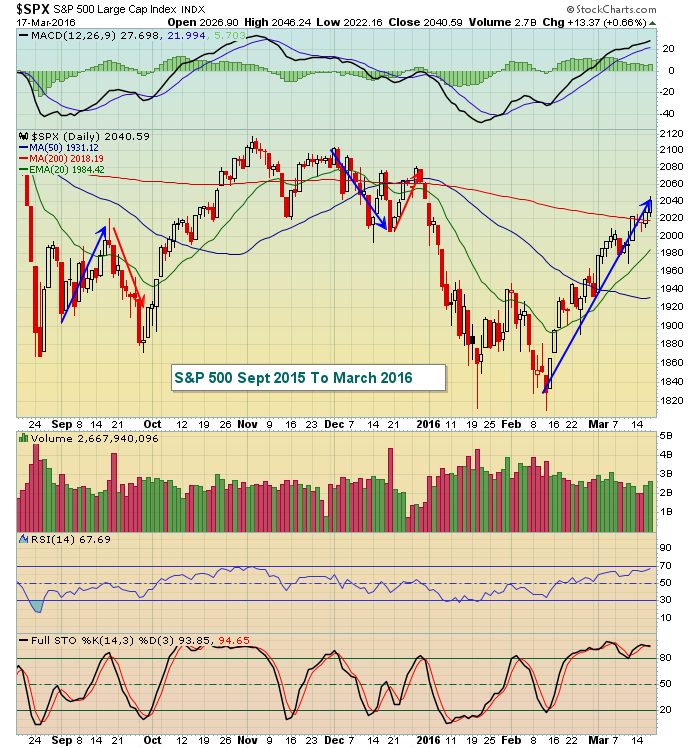 The blue line shows the trend of the S&P 500 before quad witching day, while the red line shows the trend after quad witching day. This chart represents the past two quad witching periods. The next chart shows the two quad witching periods prior:
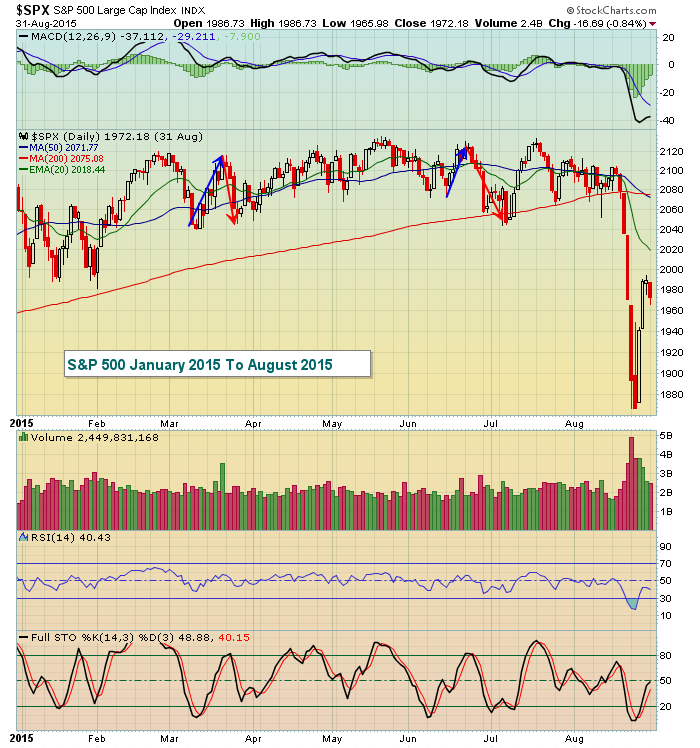 I broke the past 15 months into two charts rather than one so the periods would be more easily identifiable. But they clearly show that the tendency has been for the stock market to reverse course at or near quad witching day. Given the strength of the rally in equity prices over the past five weeks and the longer-term ambiguity, it probably makes sense to protect profits on the long side while perhaps becoming more aggressive on the short side, depending on your preference.
Sector/Industry Watch
Mortgage finance ($DJUSMF) has been very strong off the February 11th bottom after printing a positive divergence and Thursday's breakout above recent highs and the 50 day SMA would appear to be very bullish - and it is. But......well let's take a look at the daily chart first:
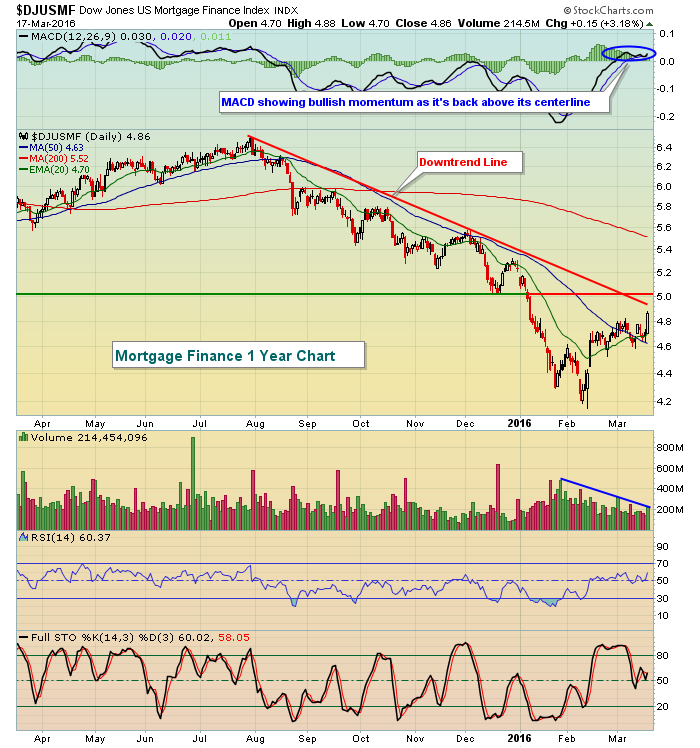 Without annotations the chart looks fairly strong, but once those price resistance and downtrend lines are drawn, this rally begins to look a bit more suspicious. Now throw in the longer-term weekly chart.....
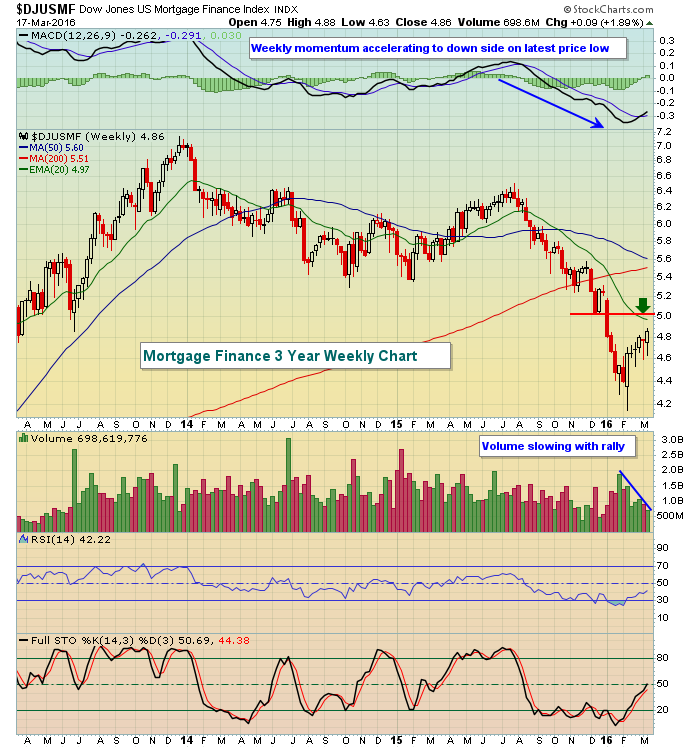 The weekly MACD has been accelerating to the downside for months and normal resistance level during a rally would be the declining 20 week EMA, currently at 4.97. That coincides with price resistance and the trendline reflected on the daily chart. This isn't to say that the DJUSMF can't move higher, but the odds are stacked against the group's continuing ascent.
Historical Tendencies
In the Current Outlook section above, I've explained how the stock market tends to change course near the third Friday of the month, particularly those third Fridays that represent quad witching day. This behavior around expiration day helps to explain why the 19th day of the calendar month has produced negative annualized returns over the past 65 years. It's the worst day of the calendar month with S&P 500 returns of -34.10%. The 9th (-19.18%), 22nd (-15.44%) and 7th (-11.85%) are the only other days of the month that produce double digit negative annualized returns.
There is one piece of good news. March 19th (tomorrow) falls on a Saturday this year. :-)
Key Earnings Reports
(actual vs. estimate):
TIF: 1.46 vs 1.40
Key Economic Reports
March consumer sentiment to be released at 10:00am EST: 92.2 (estimate)
Happy trading!
Tom
