Market Recap for Wednesday, August 10, 2016
U.S. stocks fell across all of our major indices on Wednesday (gasp!). Don't worry, it wasn't anything of technical significance. As I highlighted in the Current Outlook section below, the S&P 500 still remains poised for further short-term gains.
Four sectors rose yesterday, while five sectors lost ground. Consumer stocks led the action with consumer staples (XLP, +0.37%) and consumer discretionary (XLY, +0.21%) stocks the two top performing sectors. Distillers & vintners was the leading industry group within consumer staples while many areas of retail moved higher to spark consumer discretionary. In particular, the Dow Jones U.S. Clothing & Accessories Index ($DJUSCF) rose more than 0.50% yesterday and is at a very interesting technical point on its chart:
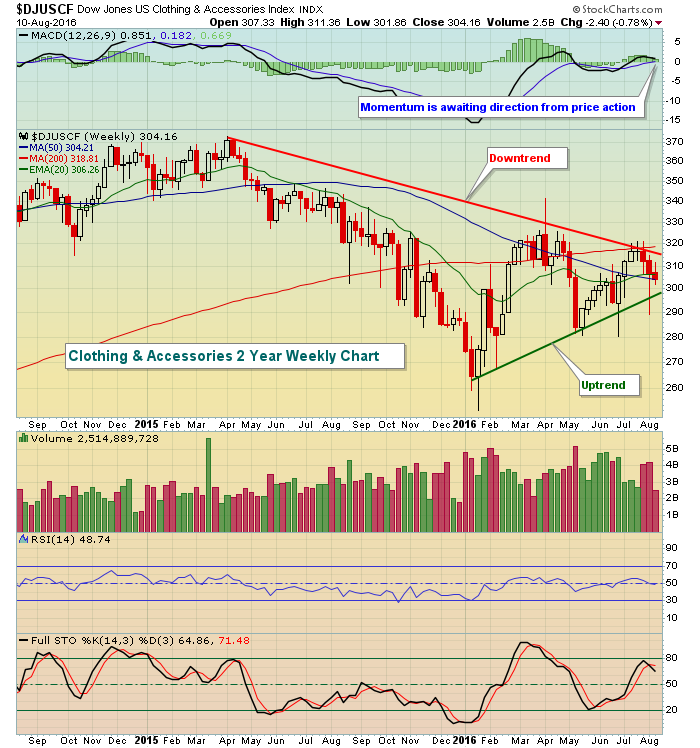 The price action continues to squeeze in triangular fashion between the longer-term downtrend and short-term uptrend. The break here will be very important. The MACD currently shows little momentum at all as it sits at centerline support, awaiting the next major move.
Energy (XLE, -1.09%) and financials (XLF, -0.79%) were the laggards on Wednesday. The suddenly declining 10 year treasury yield ($TNX) appears to have spooked those that have been rushing into financials lately. Tomorrow's retail sales report could very well have another big impact on the treasury market. Interest-sensitive stocks like banks ($DJUSBK) and life insurance companies ($DJUSIL) could be targets of buyers or sellers depending on the outcome of this report so stay tuned. In the meantime, check out the technical condition of the Dow Jones U.S. Financials Index ($DJUSFN):
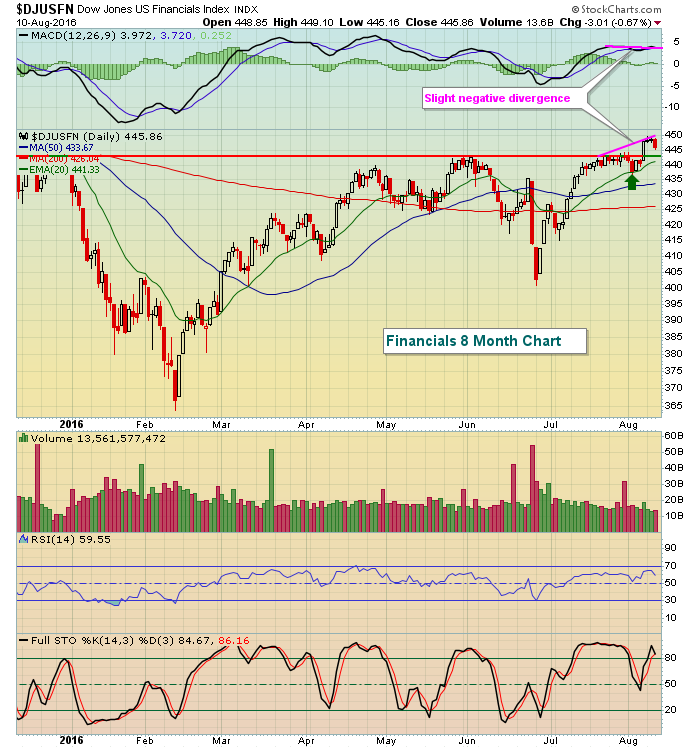 Another move higher in the DJUSFN would likely eliminate that negative divergence because it's very slight, but failure to hold onto closing price support just beneath 445 could prove troublesome.
Pre-Market Action
Dow Jones futures are up 60 points this morning as the bulls look to step up their game after settling for minor losses yesterday. One bonus will be the continuing strength in Europe, particularly in Germany where the DAX is adding to recent gains this morning. In Asia, markets were mixed overnight.
I'm expecting to see more of the same with the U.S. market primarily moving sideways to higher, at least until the retail sales report is released on Friday morning. Then we'll reevaluate based on the market's reaction.
Current Outlook:
The S&P 500 had struggled to break above 2175 on a closing basis for a couple weeks before finally doing so on August 5th. Yesterday's weakness did nothing more than to test that most recent breakout. Check it out:
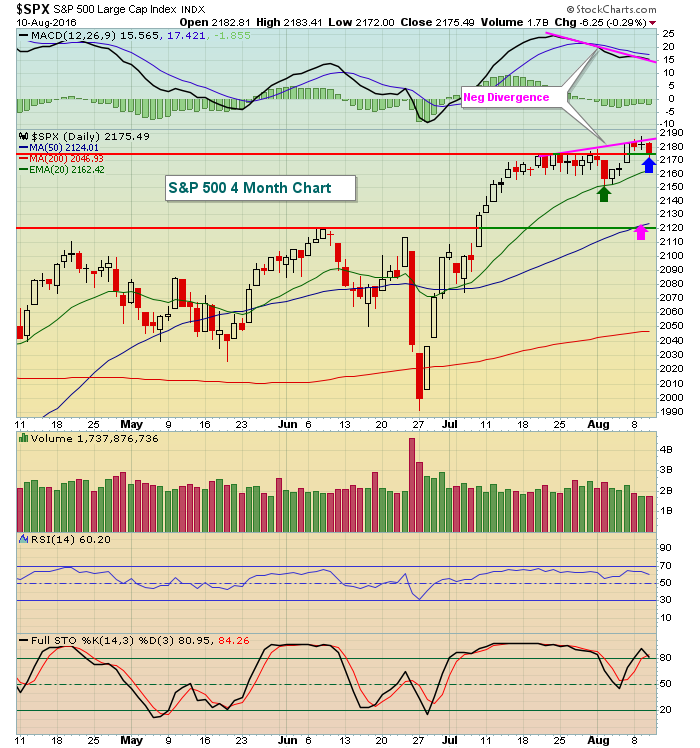 The blue arrow above represents short-term price support as that was the level we broke above on August 5th. The green arrow shows the rising 20 day EMA holding as support to begin the month of August. If the rising 20 day EMA fails to hold as support in the future after 2175 price support is lost, then I'd look for the current negative divergence to play out with a 50 day SMA test. The 50 day SMA currently resides at 2124 and is highlighted with the pink arrow.
Sector/Industry Watch
There will be a lot of focus on retail stocks in the coming days. The number of earnings reports within the space will be increasing as Kohl's (KSS) and Macy's (M) both topped estimates this morning. In addition, Dillards (DDS) and Nordstroms (JWN) both report after the bell today. JC Penney (JCP) reports tomorrow morning before the bell and we'll also get the July retail sales report at 8:30am EST on Friday morning. Below is a current technical view of the S&P Retail ETF (XRT):
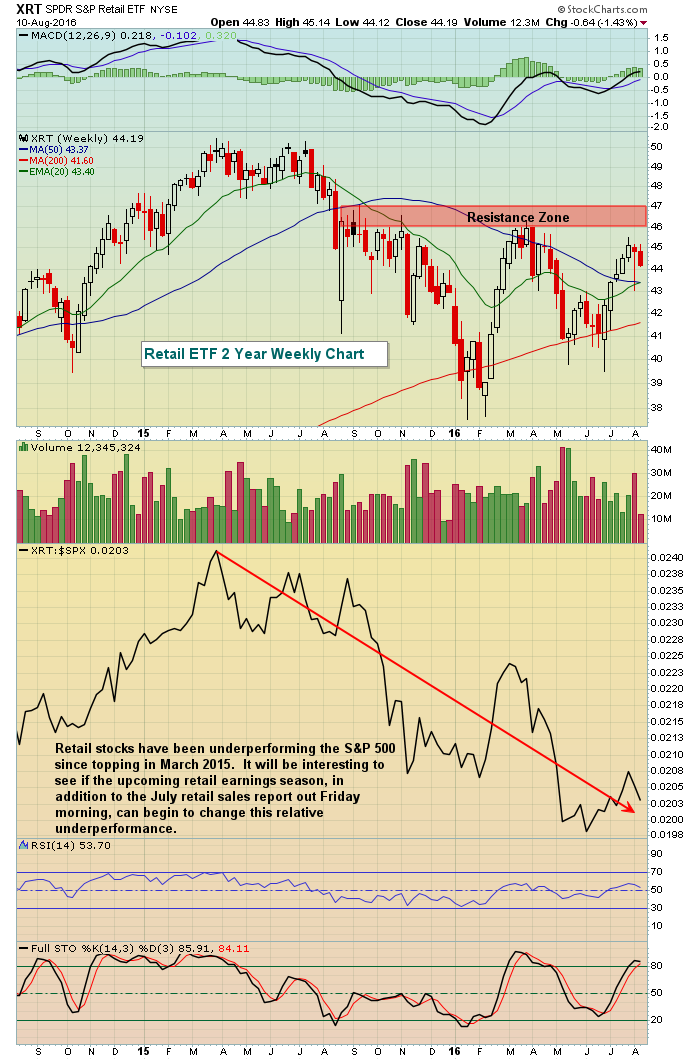 Job 1 for traders in the retail space will be to clear price resistance that's been firmly established between 46-47 on the XRT since the August 2015 flash crash. We've seen the S&P 500 break out recently to all-time highs, but the XRT remains well below its high set in mid-2015. That's resulted in a vastly underperforming group. While retail has been weak on a relative basis, it could be setting up as an outperforming group if earnings results continue to beat expectations as both KSS and M did this morning.
Historical Tendencies
Yesterday, I broke down historical performance of the S&P 500 by calendar day - from the 7th through the 10th. Those days tend to represent profit taking and to drift lower. The 11th through 18th, however, are generally days of rising prices as the annualized return by day shows below:
11th: +12.53%
12th: +8.76
13th: +10.14%
14th: +5.25%
15th: +8.19%
16th: +34.14%
17th: +15.10%
18th: +16.55%
The 1th to the 15th are close to the S&P 500's overall 9% average return that it enjoys throughout the year, but you can see that the historical outperformance really begins to kick in on the 16th and continues through the 18th.
Key Earnings Reports
(actual vs. estimate):
BABA: .74 vs .61
KSS: 1.22 vs 1.04
M: .54 vs .40
(reports after close, estimate provided):
DDS: .34
JWN: .55
NVDA: .37
Key Economic Reports
Initial jobless claims released at 8:30am EST: 266,000 (actual) vs. 265,000 (estimate)
Happy trading!
Tom


