Market Recap for Wednesday, November 30, 2016
Crude oil ($WTIC) rose more than 9% on Wednesday and energy shares (XLE, +5.08%) were the beneficiary. Rising treasury yields also helped to lift the financial sector (XLF, +1.35%) with banks ($DJUSBK) storming to another high. But the bifurcation was quite apparent in many areas of the market. Despite a late day selloff, the Dow Jones managed to eke out a 2 point gain. The S&P 500, NASDAQ and Russell 2000, however, all finished lower with notable weakness on the NASDAQ. The NASDAQ 100 ($NDX) lost 1.28%. So while energy and financials were strong, there was a ton of profit taking that took place simultaneously.
All industry groups within energy rose on Wednesday, but the primary strength was in exploration & production ($DJUSOS) and oil equipment and services ($DJUSOI), with the latter's breakout being featured below:
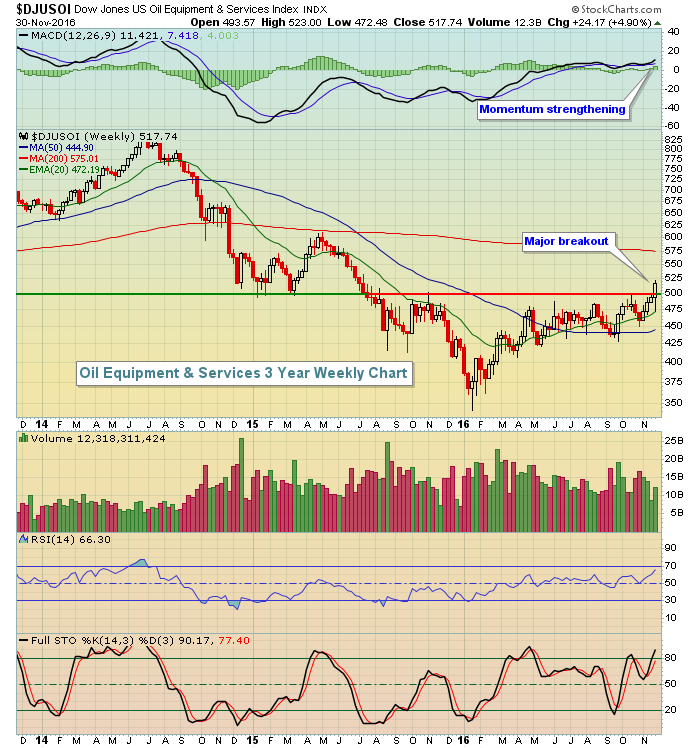 500 has been a key pivot area on the DJUSOI for years. Yesterday's surge clearly topped that resistance and with the weekly MACD just beginning to turn higher, this looks like a rally that will be sustainable. As I've said before, look for energy to remain one of the relative leaders as we head into 2017. A spike in crude oil prices above $52 per barrel would likely cement this relative leadership.
The strength in energy came as OPEC agreed to cut production for the first time in eight years. This agreement will likely be the catalyst to trigger a $52 per barrel breakout.
Pre-Market Action
Crude oil ($WTIC) is on the rise again with black gold up another 2.2% to $50.54 per barrel. It's getting close to very critical resistance near $52 per barrel and will likely be the catalyst once again for a strong energy sector - at least at today's open. With a little more than 30 minutes to the opening bell, Dow Jones futures are up 19 points. Most traders will be watching the NASDAQ's performance today after that tech-laden index was hammered on Wednesday. Still, all technical signs to me point to higher prices near-term. I'm watching rising 20 day EMAs. On the NASDAQ, that means another 0.4% down to the current 20 day EMA at 5304. During momentum streaks like the one we've been in since early November, rising 20 day EMAs generally provide solid support.
Around the globe, we saw strength overnight in Asia. However, Europe has been a bit more troublesome with the FTSE down a little more than 1% and the German DAX failing to negotiate 10800 price resistance in recent sessions.
Current Outlook
I like to see the more aggressive NASDAQ outperforming on a relative basis vs. the benchmark S&P 500. That's a hallmark of a bull market advance as it shows that traders are willing to take additional risks to fuel a bull market. That relative strength of late has been missing and it begs the question - is this rally about to fizzle? I don't believe so. Keep in mind that the longer-term relative strength picture will have occasional bumps along the way. Technology will not outperform every day, or even every week or month. Aggressive stocks within the NASDAQ do need to pause from time to time. The beauty of late is that money has rotated away from technology, but into other aggressive areas like industrials and financials. While not considered an offensive sector, money rotating into energy is better than seeing utilities or consumer staples lead.
Check out the relative strength of the NASDAQ:
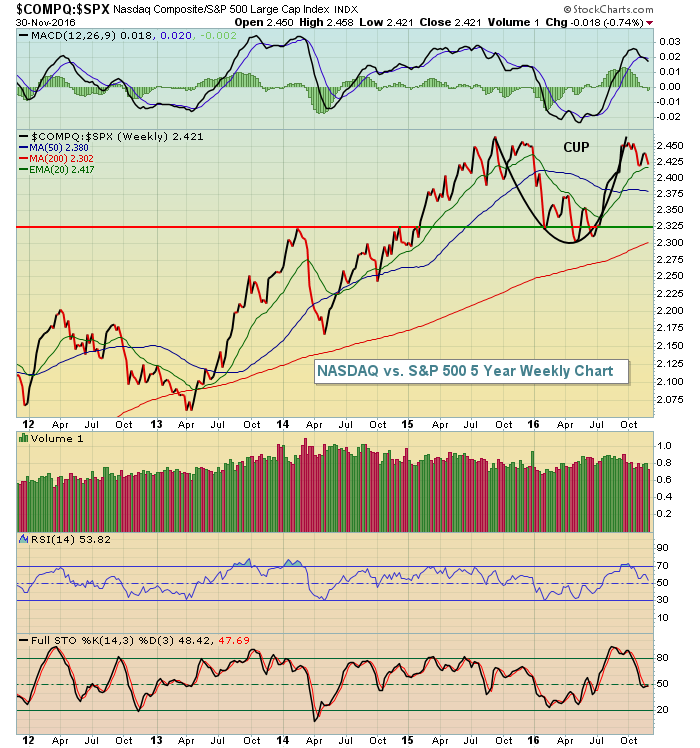 2014 and 2015 saw extreme leadership from the NASDAQ, but that strength cooled in the first half of 2016. Post-Brexit, we saw the relative strength return in a big way and the NASDAQ has now printed a relative cup off its prior relative uptrend. The recent relative weakness appears to be a handle forming. My guess is that we'll see another leg higher in the market over the next several weeks and that the NASDAQ will once again assume its leadership role.
Sector/Industry Watch
The rally in technology shares simply got ahead of itself and many overbought industry groups needed some relief, which we've been seeing. The Dow Jones U.S. Software Index ($DJUSSW) has other technical issues besides being overbought. It's dealing with slowing momentum on its weekly chart in the form of a negative divergence. If technology regains a leadership role in December, it may have to do so without help from software. Check out the negative divergence:
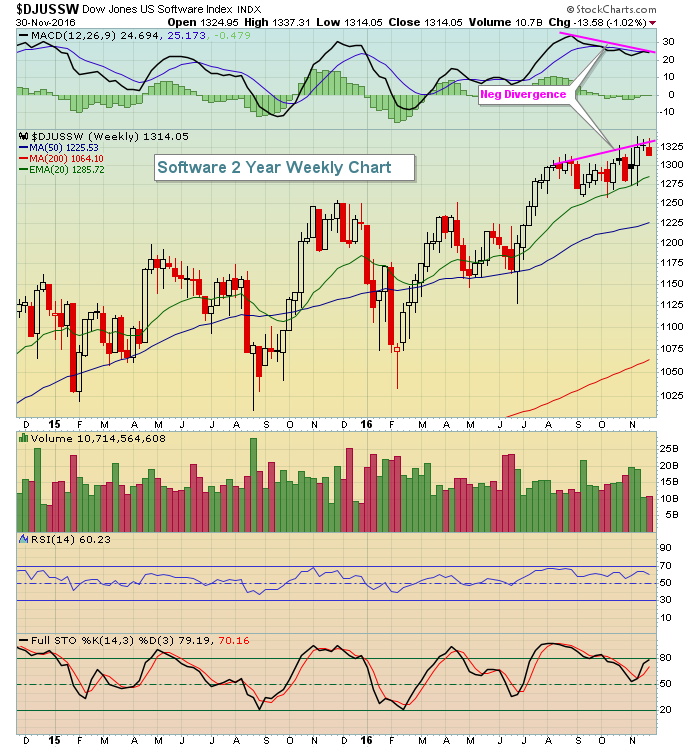 Volume wasn't bad to start November and at the time that the negative divergences printed, so there are mixed signals here. But if the DJUSSW fails to hold rising 20 day EMA support, which it's been doing for the past several months, then I'd look for a test of 1250 price support, just about the same time that the rising 50 day SMA touches that level as well.
Historical Tendencies
The NASDAQ tends to perform quite well as it opens the historically bullish month of December. Over the past 45 years, the NASDAQ has produced annualized returns of +80.24% and +49.51% on December 1st and 2nd, respectively. It also won't hurt that Thursdays and Fridays tend to produce above average results based on historical calendar day of the week performance as well.
Key Earnings Reports
(actual vs. estimate):
CM: 1.98 vs 1.84
DCI: .38 vs .35
DG: .89 vs .92
KR: .41 vs .42
TD: .93 vs .91
(reports after close, estimate provided):
AMBA: .68
ULTA: 1.37
WDAY: (.51)
Key Economic Reports
Initial jobless claims released at 8:30am EST: 268,000 (actual) vs. 253,000 (estimate)
November PMI manufacturing index to be released at 9:45am EST: 53.9 (estimate)
November ISM manufacturing index to be released at 10:00am EST: 52.3 (estimate)
October construction spending to be released at 10:00am EST: +0.6% (estimate)
Happy trading!
Tom
