Market Recap for Monday, June 5, 2017
It wasn't a horrible day on Wall Street. After all, we've been in a strong advance since mid-May with the S&P 500 rising nearly 4% during that span. So a little bit of profit taking shouldn't be of too much concern. It was a typical Monday where we saw controlled selling in a complacent and bullish market. Mondays have risen just 47% of the time on the S&P 500 since 1950. It's the only day of the week where we've seen more losses than gains. I'm never surprised by some Monday selling. Personally, I believe it's psychological as much as anything. Who wants to go to work on Monday? Wednesdays, Thursdays and Fridays, on the other hand, have proven over time to be the best calendar days of the week as we approach the weekend.
Losses were definitely contained on Monday and the two reasons were energy (XLE, +0.18%) and financials (XLF, +0.17%) - unlikely heroes. The XLE has been suffering from falling crude oil ($WTIC), while the XLF has been suffering from the falling 10 year treasury yield ($TNX). The most recognizable name in energy - Exxon Mobil (XOM) - had closed at its lowest level in over a year on Friday with accompanying heavy volume so it was "do or die" time for XOM. Fortunately, it rallied and printed a reversing piercing candle yesterday. Here's the current view of XOM:
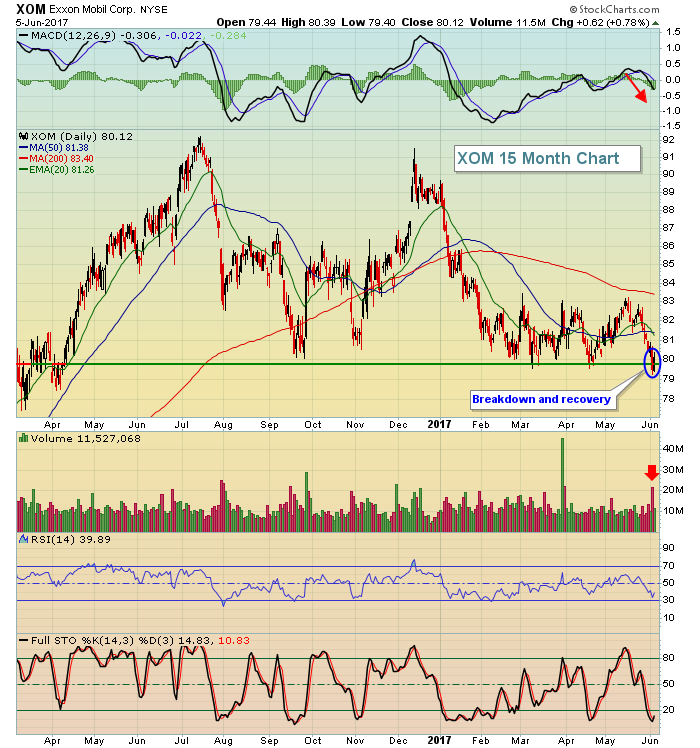 The piercing candle gives the bulls near-term hope, but that MACD turning lower suggests selling momentum is accelerating and Friday's big losses on heavy volume cannot be ignored. Therefore, consider the Friday low as an important short-term support level. It won't help that XOM is in the midst of its worst historical period of the year - May through August (see Historical Tendencies below).
Pre-Market Action
Dow Jones futures are currently lower by 44 points as gold rises nearly 1% and crude oil moves fractionally lower. Asian markets were mixed while European markets are mostly lower. The German DAX is down nearly 1%. Because that index correlates so closely with the S&P 500, that's not a particularly good sign for U.S. equities today.
Current Outlook
The ratio of transports vs. utilities ($TRAN:$UTIL) provides us clues as to how traders view the economic outlook. A rising ratio shows that traders favor transportation stocks, which occurs when an improving economic picture is predicted. I like to see this ratio rising to support rising S&P 500 prices. A declining ratio indicates that traders would rather own utilities. Utilities tend to perform best - on a relative basis - when the economic picture is cloudy or expected to worsen. That sends money into treasuries and yields falter, making the dividend yields on utilities more attractive.
Currently, this ratio is not good and is one piece of the market jigsaw puzzle that favors the bears. Check it out:
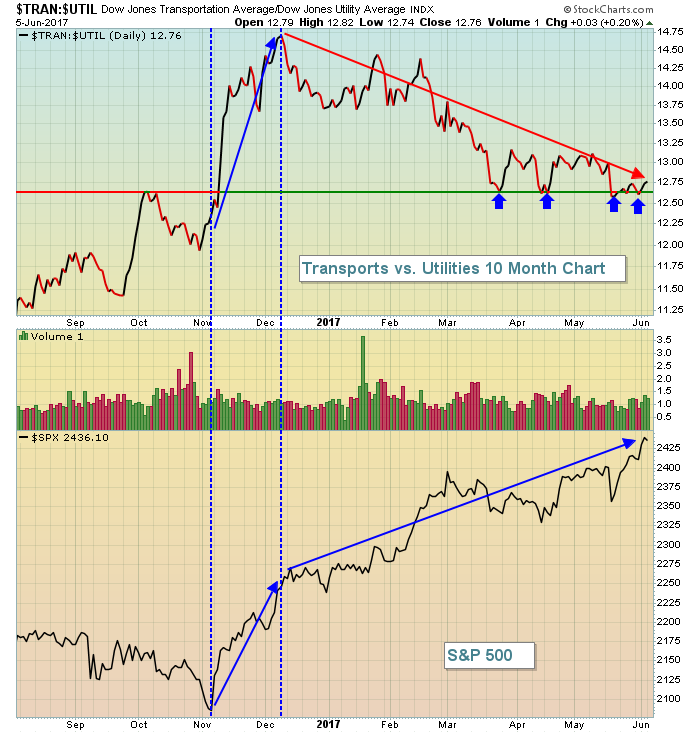 The rise in November into early December was very strong so I'm willing to give the 5-6 month downtrend the benefit of the doubt and consider it consolidation. But there's a relative strength support line that's now been tested several times (blue arrows). I don't want to see that lost. How the stock and bond markets react to next week's Fed decision will be very important.
Sector/Industry Watch
The Dow Jones U.S. Brewers Index ($DJUSDB) stalled on Monday after forging to a nearly three month high close on Friday. The latest rally has suggested that the DJUSDB saw an exhaustion gap in early May on heavy volume. Here's the chart:
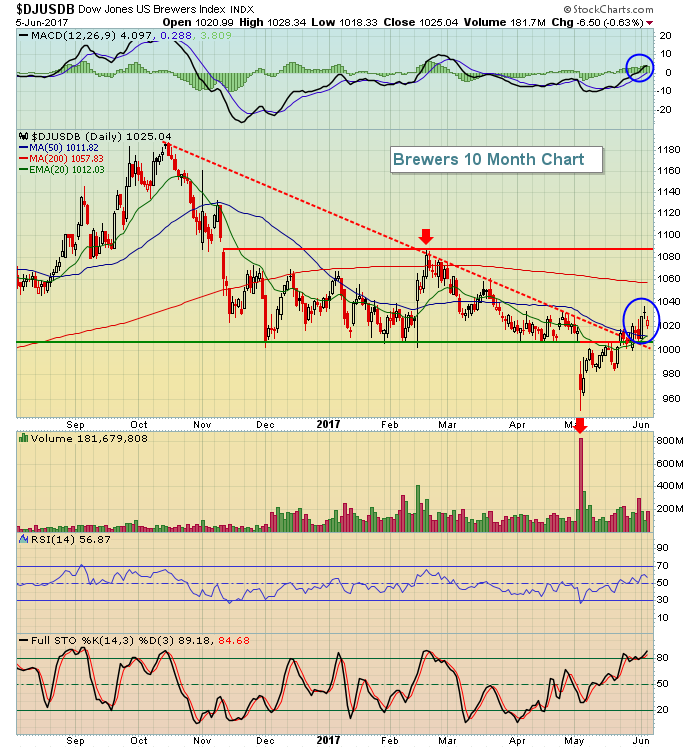 Exhaustion gaps occur at the end of uptrends and downtrends with extremely heavy volume and they reverse the longer-term trend. Thus far, the May gap lower appears to be exactly that for the brewers. Since that gap lower, an uptrend has begun and the DJUSDB closed back above its declining 20 day EMA and price resistance, both of which were just above 1000. The red arrow on the price chart marks the latest reaction high near 1090. That would be the next target and it coincides with the open after a large gap down in November 2015. Breaking the downtrend line (red dotted line) with a bullish MACD crossover (blue circle) suggests we'll see more strength ahead. 1000 should provide solid support during any period of weakness.
Historical Tendencies
Exxon Mobil (XOM) broke down briefly on Friday only to recover a bit yesterday. Still, it's teetering on a significant breakdown and its historical tendencies show that XOM struggles from May through August. Here's the seasonal summary:
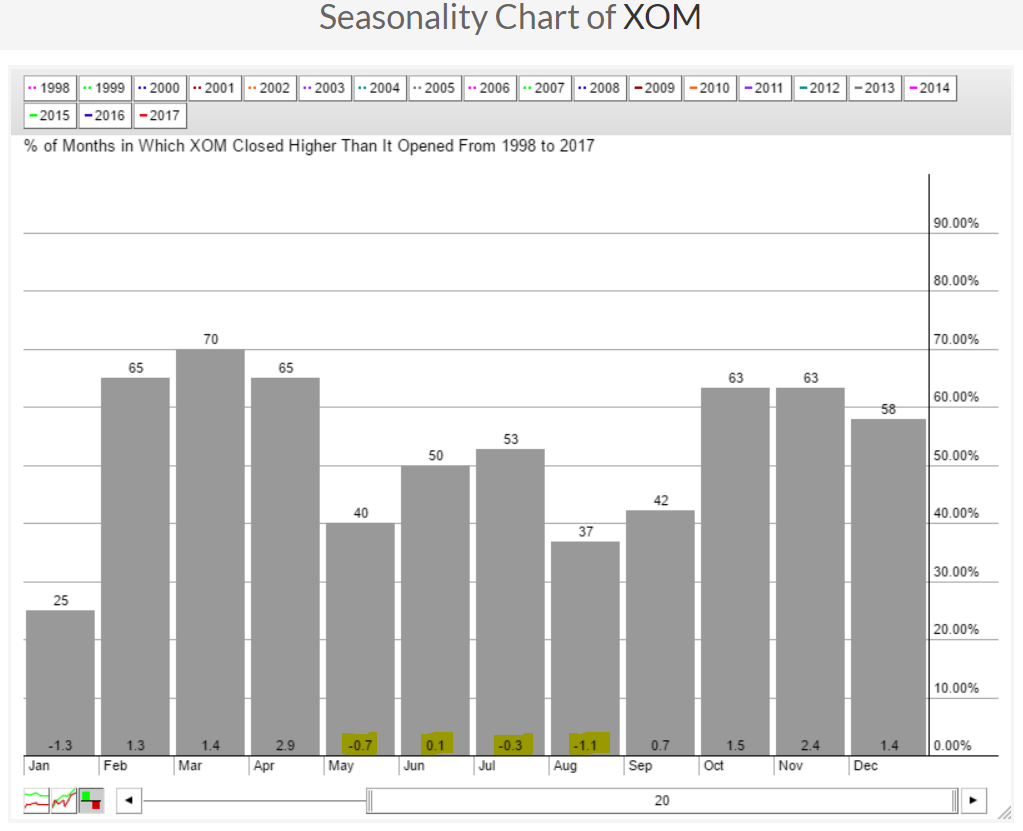 Over the past twenty years, the highlighted average returns for each of the calendar months from May to August don't lie. XOM has entered a difficult seasonal period and this will only provide further headwinds for this energy giant as it battles weak technical conditions.
Key Earnings Reports
(actual vs. estimate):
HDS: .63 vs .65
Key Economic Reports
None
Happy trading!
Tom
