Reminder:
If you enjoy my blog, please look for the green "Notify Me" button at the bottom of this article and subscribe! Simply type in your email address and hit that button and VOILA! You'll receive my articles the moment they're published. And don't worry, we won't send you anything other than the blog articles that you've subscribed to receive. Best of all? It's completely FREE!!! Thanks for your support. :-)
Got any comments about my articles? How about the new "Seasonal Outlook" section below? Send me an email at "tomb@stockcharts.com". Thanks so much and happy trading!
Market Recap for Thursday, October 19, 2017
U.S. stocks got off to a very rough start on Thursday, but any thoughts of a repeat of Black Monday from October 19, 1987, on its 30 year anniversary quickly vanished. Like so many recent attempts by the bears, this weakness did not last. In fact, intraday lows were reached in the first 30 minutes of trading and buying resumed throughout the balance of the session. By day's end, the Dow Jones and S&P 500 both finished fractionally higher to set new all-time high record closes. The NASDAQ and Russell 2000 certainly lagged, but they too closed well off of earlier intra-session lows.
Utilities (XLU, +1.05%) and healthcare (XLV, +0.61%) were the beneficiaries of Thursday's rally, while consumer staples (XLP, -0.53%) lagged. What's interesting there is that these three industry groups represent the defensive areas of stocks, yet they finished on opposite ends of the spectrum.
Volatility ($VIX) popped early in the session, but closed near its low. I feature the VIX in the Current Outlook section below.
Pre-Market Action
Futures are bright this morning as the U.S. looks to continue the global strength overnight in Asia and this morning in Europe. The Senate passed a budget for tax reform and that's helping futures with the Dow Jones looking to open higher by 85 points.
Current Outlook
The Volatility Index ($VIX), at the start of the past two bear markets, was above the 16-17 level and the VIX never moved beneath 16-17 throughout both bear markets. A bear market requires certain conditions to be present and one is elevated expected volatility, which is exactly what the VIX measures. While we saw a quick pop in the VIX at yesterday's open, it quickly retreated and we remain firmly entrenched in bull market area on the VIX:
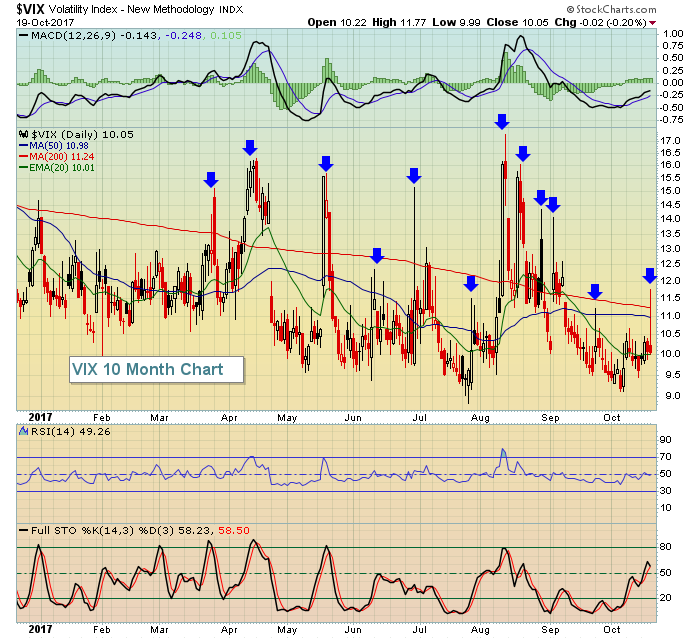 The blue arrows mark key pops in the VIX, but each and every time, we see the VIX retreat back to historically low levels from 9-10. That's the sign of a continuing bull market. Notice that the highs on the VIX during 2017 have topped around that 16-17 area. I'm bullish U.S. equities for the foreseeable future.
Sector/Industry Watch
Next week tends to be a very bearish week - at least from a historical perspective. You can check out the NASDAQ's annualized performance by day (since 1971) in my Trading Places blog article on Thursday. If we do see some profit taking next week, it would seem that our most overbought industry groups would be likely targets. Industrial suppliers ($DJUSDS) lost more than 1% yesterday, but it still ranks as the best performing industry group over the past month, having gained 10.55% over that time frame.
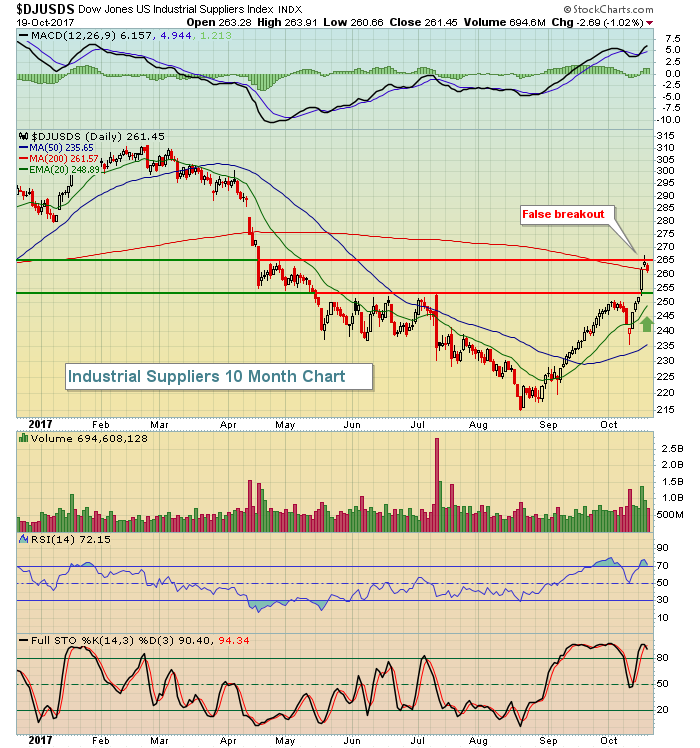 Technical conditions have obviously improved tremendously here, but there's no denying the overbought conditions. Wednesday's shooting star candle off an uptrend resulted in a false breakout above the attempted rally back in late April. The rising 20 day EMA, currently at 248.89, would be the initial area of support.
Seasonal Outlook
I'm adding a new section to this daily Trading Places blog - Seasonal Outlook - where I'll periodically (1-2 times per month) take a look into the approaching months to identify sectors or stocks that have strong seasonal patterns. As I look toward the historically bullish November-December time frame, several stocks really stand out.
The numbers below are each stock's percentage of its annual average gain earned during the months of November/December:
S&P 500 - Best:
Akamai (AKAM): +84.7%
Red Hat (RHT): +67.1%
Wyndham (WYN): +64.6%
Autodesk (ADSK): +63.4%
American Tower (AMT): +61.4%
S&P 500 - Worst:
Cerner (CERN): +0.0%
Best Buy (BBY): +0.0% (featured below in Historical Tendencies section)
PVH Corp (PVH): +0.6%
Cooper Cos. (COO): +1.0%
Amphenol (APH): +3.6%
NASDAQ 100 - Best (excluding AKAM and ADSK, which were included above with the S&P 500):
Sirius XM Holdings (SIRI): +61.6%
Western Digital (WDC): +51.9%
Incyte (INCY): +51.4%
JB Hunt (JBHT): +48.1%
Express Scripts (ESRX): +44.1%
NASDAQ 100 - Worst:
priceline.com (PCLN): -3.5%
Vertex Pharma (VRTX): -1.2%
Hasbro (HAS): +0.0%
Looking at the above best and worst performers, a couple of interesting charts pop out at me. Both SIRI and WDC are very bullish in the November and December months and both are in very bullish continuation patterns that have yet to break to the upside. Check them out:
SIRI:
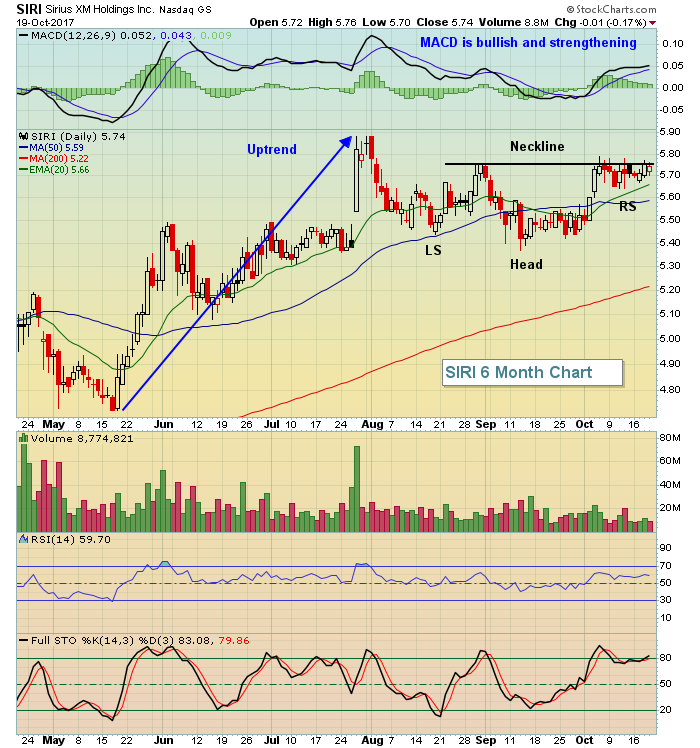 In addition to the bullish inverse head & shoulders pattern identified above, October's formation could easily be interpreted as a bullish ascending triangle. The inverse right shoulder has actually been printing higher lows with recent highs topping out in the 5.75-5.80 range. I love this pattern.
WDC:
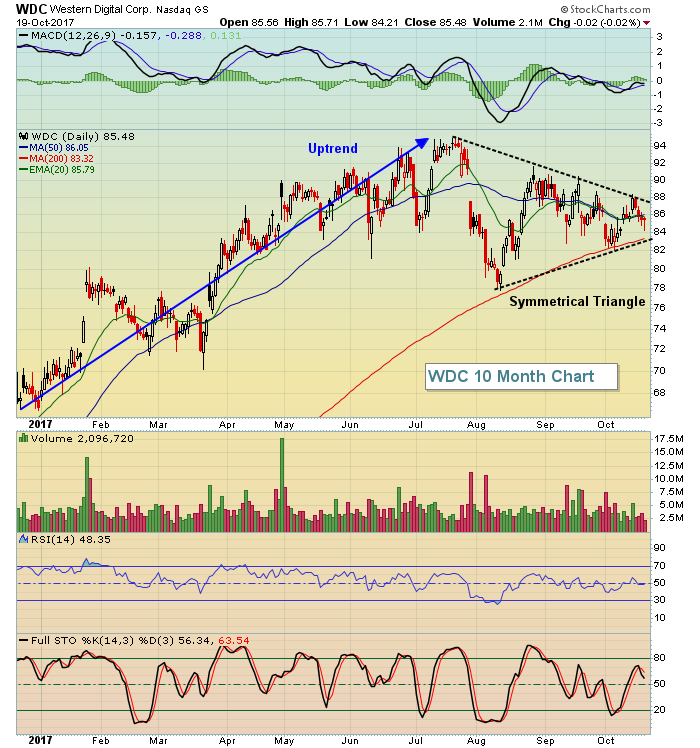 WDC has been consolidating in a bullish symmetrical triangle for nearly three months. While these patterns can break in either direction, we are heading into WDC's most bullish historical season and this pattern has developed following an uptrend. These types of triangle consolidation patterns tend to be break in the direction of the prior trend - in this case, higher.
Historical Tendencies
You might think that Best Buy (BBY) would be a great performer during the November/December months as the holiday season approaches. But, in reality, the exact opposite typically occurs. Check out the seasonal pattern for BBY:
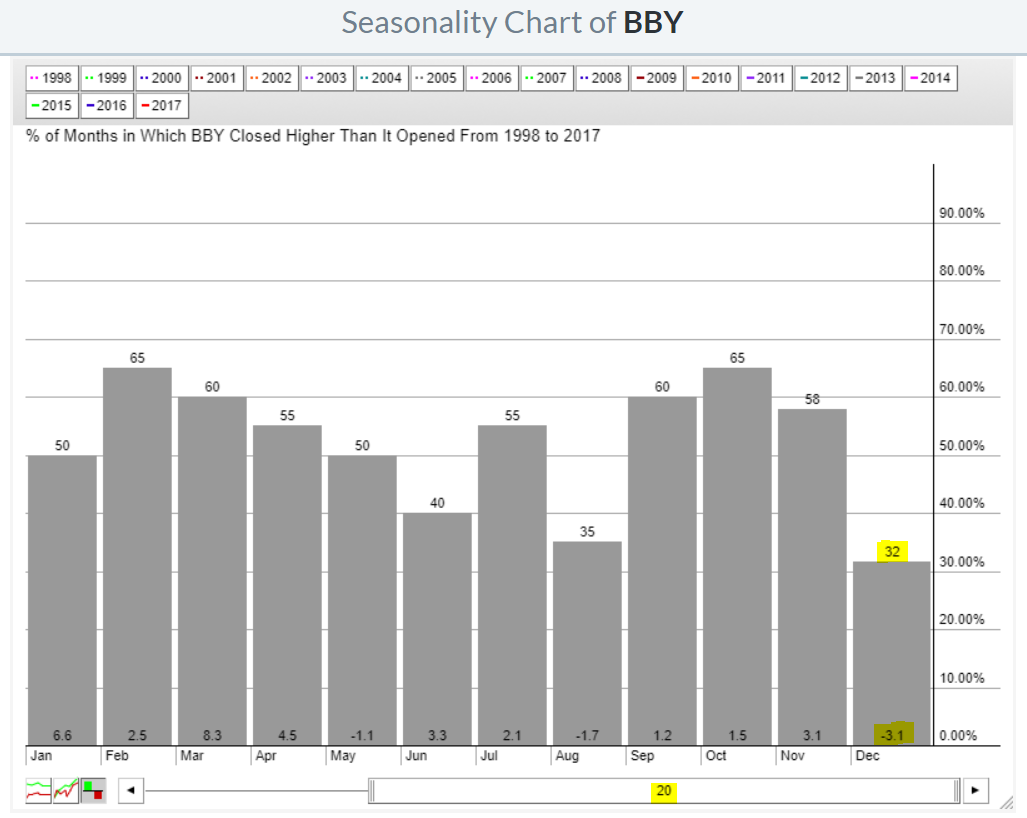 November has proven to be a solid month, but gains in November have historically been erased in December. Interesting. The best time to own BBY - at least from a historical perspective - is after the holiday season an during the first four months of the year, where BBY enjoys average monthly gains of 6.6%, 2.5%, 8.3% and 4.5% from January through April, respectively.
Key Earnings Reports
(actual vs. estimate):
GE: .29 vs .49
HON: 1.75 vs 1.74
PG: 1.09 vs 1.07
SLB: .42 vs .42
STI: 1.06 vs 1.06
SYF: .70 vs .64
Key Economic Reports
September existing home sales to be released at 10:00am EST: 5,300,000 (estimate)
Happy trading!
Tom


