Market Recap for Tuesday, December 26, 2017
Energy stocks (XLE, +0.88%) continued their merry way higher, which really isn't surprising after the sector made a very significant price breakout above the 70 level. With an RSI approaching the 80 level now, however, I wouldn't be surprised to see a bit of consolidation, or even profit taking, with money rotating to other areas for a bit. Here's the current look at the XLE:
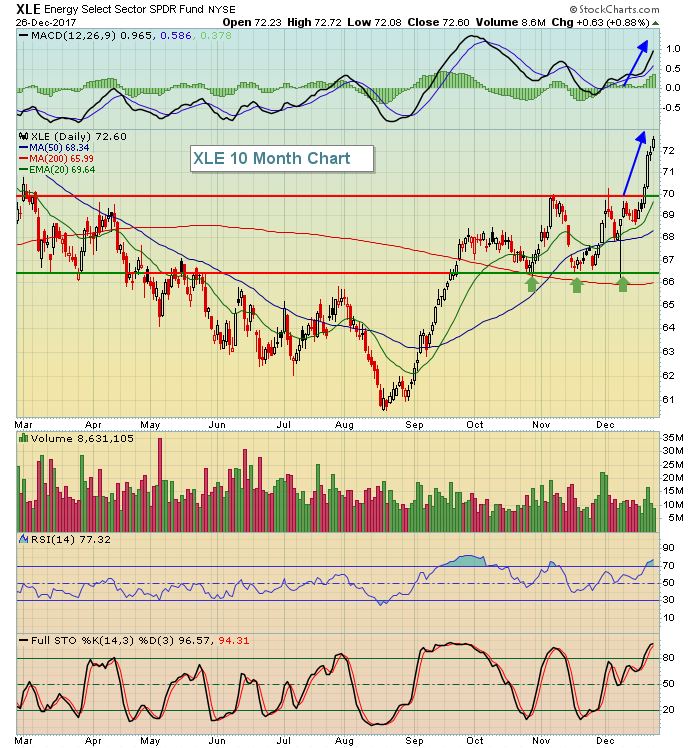 Price action has been very strong and price momentum (MACD) is accelerating as well - a very bullish combination. Pullbacks are likely to be very shallow and should present buying opportunities within various energy industry groups. So why the jump in the XLE as we approach year end? Crude oil prices are one key reason:
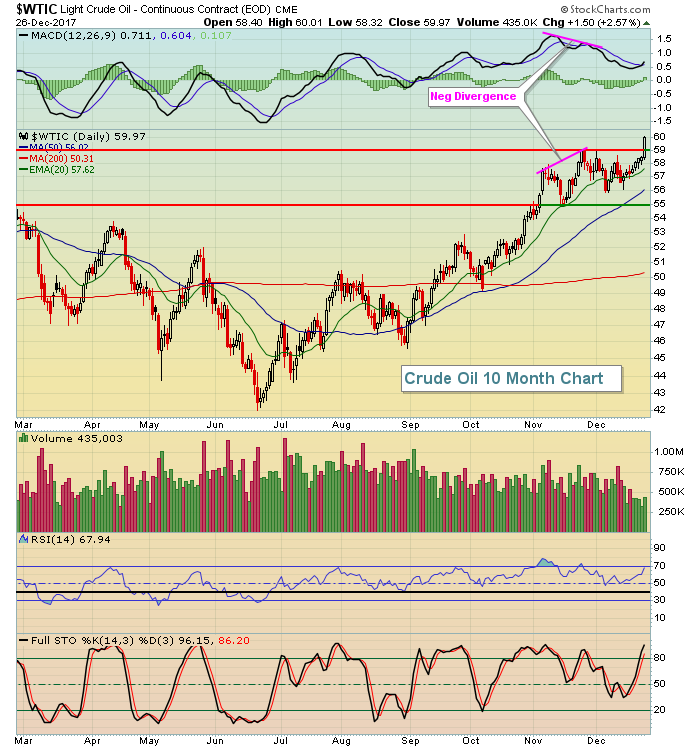 After a negative divergence printed, crude oil's upside momentum slowed, although we never did see a MACD centerline "reset" or a 50 day SMA test, which is what I tend to look for. The breakout above $59 per barrel and approach of $60 is a very bullish development for energy stocks so I'd continue to look for more of what we've been seeing - with profit taking along the way.
Pre-Market Action
U.S. futures are relatively flat this morning with little economic or earnings news on today's docket. The 10 year treasury yield ($TNX) fell slightly on Tuesday and it's continuing a slow decline this morning. That represents a bit of rotation back towards the defensive bond market, which is providing a bit of a headwind for U.S. stocks as we wrap up 2017.
Current Outlook
As a refresher, the benchmark S&P 500 tends to move in the same direction as many global market indices, but probably none moreso than the German DAX ($DAX). And it's fairly obvious that the DAX is struggling to break out of its consolidation mode:
 Note that the first Fibonacci retracement level (38.2%) from the late-August to early-November advance resides at 12900 with the next level (50.0%) close to 12700. The recent price low was just beneath 12900 so I'd keep a very close eye on support in the 12700-12900 range. Failure to hold this support area would be a signal that the S&P 500 could face strong headwinds in 2018. It wouldn't be a guarantee of S&P 500 weakness, but it sure would begin to paint a much more cautious picture.
Sector/Industry Watch
During the January 2017 StockCharts Outlook webinar, I suggested the renewable energy ($DWCREE) space could be a big winner in 2017. The group had been beaten down for 2-3 years and historically low energy prices weren't helping. Many times, nuggets of investing gold can be found amongst the ashes of a downtrodden industry. So where can we look in 2018? What might be the gold nugget that everyone is overlooking right now?
I'm going to suggest that you keep a very close eye on key technical developments among brewers ($DJUSDB) in early 2018. They are among the worst performing industry groups in 2017 and are just now approaching a significant price support level in a longer-term uptrend. The group is also very defensive in nature, so should money rotate away from many overbought areas, the DJUSDB could be a major beneficiary. Here's the chart:
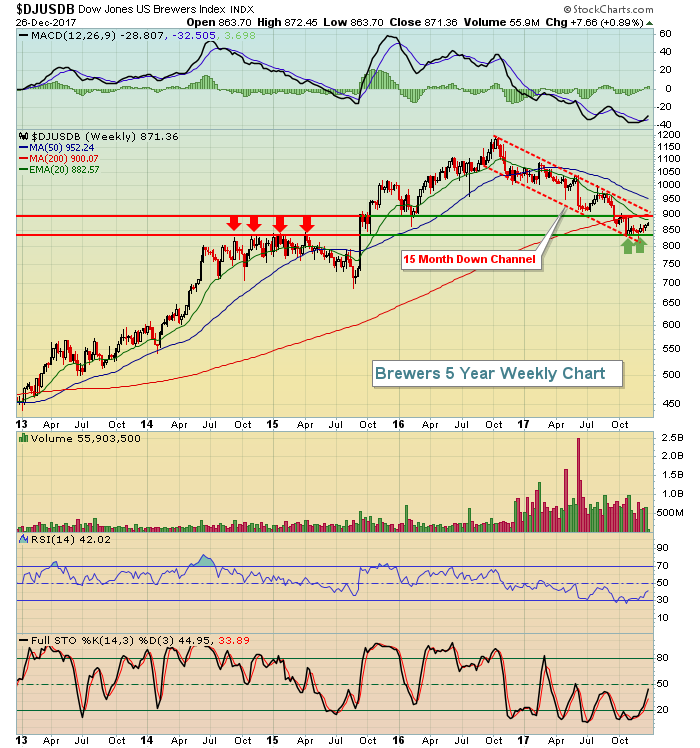 As a short-term trader, I'm typically looking for market rotation in the near-term, not areas that are out of favor for more than a year. But if I had to invest now for one year, with no ability nor desire to reallocate my investments during the year, I'd be hard-pressed to find a better group to park my money. So as we say goodbye to 2017, let's all eat, drink and be merry!
Historical Tendencies
We know that the U.S. stock market tends to be very bullish as we close out calendar years, so let's look ahead.
On the S&P 500 (since 1950), January has produced annualized returns of +11.57%, or slightly better than the average annual return of approximately 9%. That places January in 6th place out of the 12 calendar months.
On the NASDAQ (since 1971), however, January has been the best calendar month, producing annualized returns of +31.72%. If we look at results since 1990, January still performs well (+18.89%), but trails December (+29.71%), October (+29.67%) and November (+24.47%).
Key Earnings Reports
None
Key Economic Reports
December consumer confidence to be released at 10:00am EST: 128.0 (estimate)
November pending home sales to be released at 10:00am EST: +0.5% (estimate)
Happy trading!
Tom


