Market Recap for Wednesday, January 17, 2018
The Dow Jones didn't fail this time. After Tuesday's huge reversal from above the 26,000 level, there were a number of question marks about whether the current rally would continue. The Dow Jones answered those questions rather emphatically with its first close above 26,000 in history. The Dow Jones has now cleared its fifth psychological thousand point level in the past six months, truly astounding.
Leadership on Wednesday came from an important area of the market - technology (XLK, +1.50%). Semiconductors ($DJUSSC) were particularly strong and their chart is bullish. The DJUSSC is featured below in the Sector/Industry Watch section. The advance on Wednesday was very strong in that all nine sectors participated in the rally, even utilities (XLU, +0.62%). There weren't many negatives to take away from the action, but I'll point out one. Three of the four aggressive sectors - financials (XLF, +0.75%), industrials (XLI, +0.55%) and consumer discretionary (XLY, +0.48%) - performed poorly on a relative basis. But let's be clear about one thing. It was only one day's relative performance. Looking back at the past several months, these groups have been very strong on a relative basis and that really underscores the strength of the bull market. Take a look at this chart:
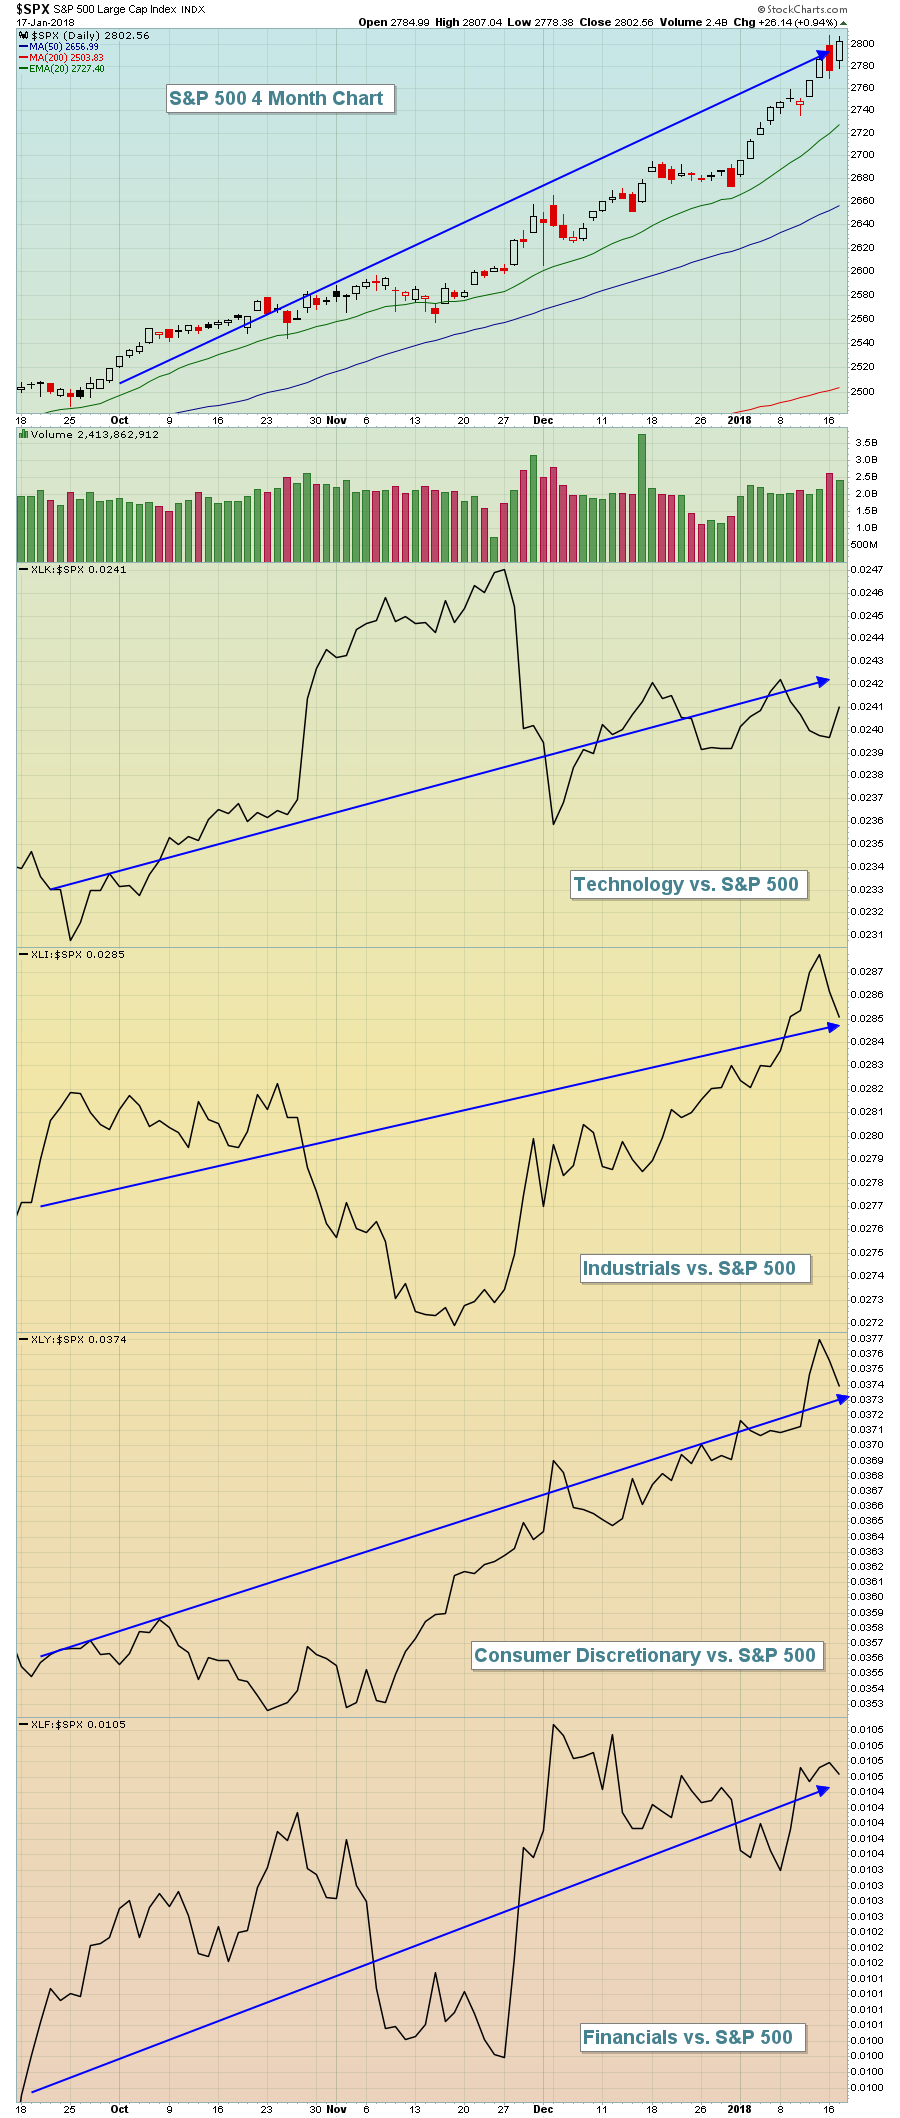 While we've seen pockets of relatie weakness in each sector, there's no doubt that the overall relative trend is moving higher. The time to worry about the stock market comes when we begin to see multiple aggressive sectors break down on a relative basis, especially during a rising market. That tells us that the stock market is beginning to experience leadership from defensive sectors and that's a sign of weakness.
Pre-Market Action
Crude oil ($WTIC) is back above $64 per barrel this morning and the 10 year treasury yield ($TNX) has climbed four basis points to a critical 2.62% yield resistance level. December housing starts came in well below expectations, but initial jobless claims were much better than anticipated. Despite these mixed economic reports, the TNX is on the verge of a very significant breakout.
Asian markets were mixed overnight and we're seeing similar mixed action in Europe this morning. Dow Jones futures are higher by 21 points in an attempt to set another all-time record high.
Current Outlook
Will the S&P 500 close above 2805 today? That may seem like a silly question to ask of one day in history, but check out the Historical Tendencies section below. If you believe the S&P 500 can gain another 10% over the next three months, the odds of such a move will be dramatically higher (according to history) if the S&P 500 closes above 2805 today.
Here's a current look at the S&P 500 hourly chart:
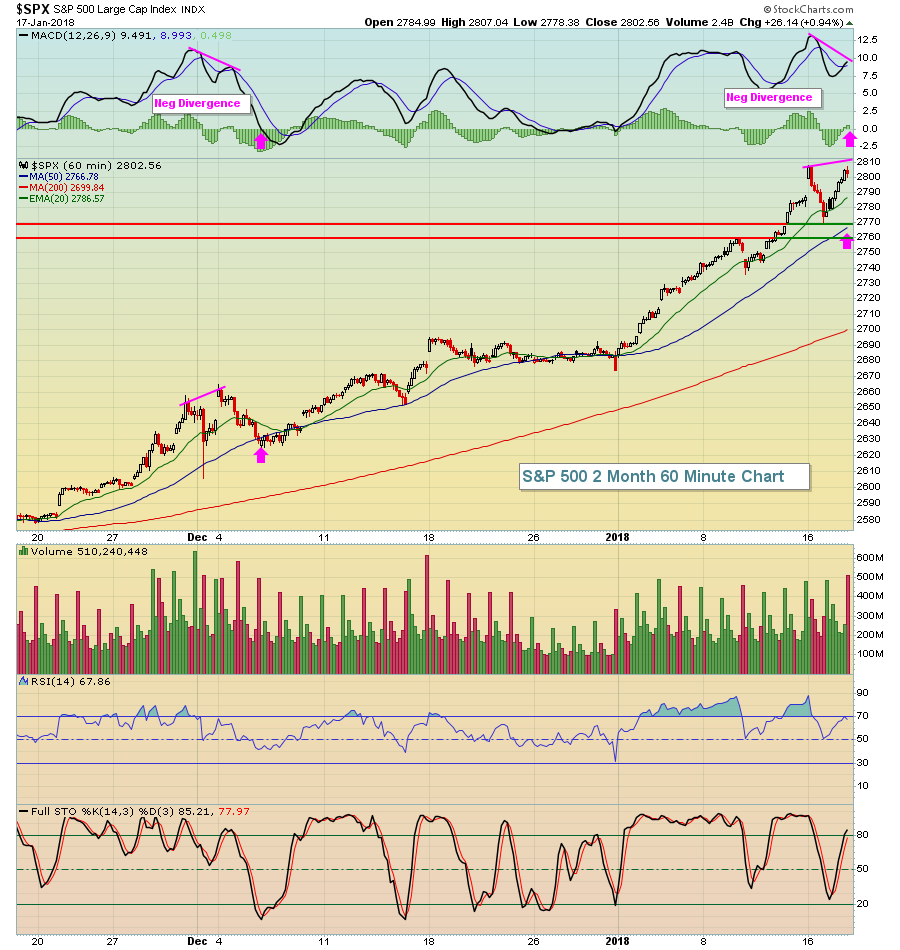 Technically, there's no negative divergence in place currently. A negative divergence requires a new price high. So the point here is that another push higher in the S&P 500 today would likely result in the appearance of slowing price momentum and, potentially, a near-term top - similar to the one that occurred in early December. Note that weakness back then lasted just two trading days, long enough to allow the hourly MACD to reset at its centerline (actually just beneath it).
Sector/Industry Watch
Technology stocks were very strong on Wednesday, with semiconductors ($DJUSSC) leading the pack. While you might argue there are cracks in the foundation of this bull market advance (overbought, etc), the semiconductor group wouldn't be a great place to begin arguing:
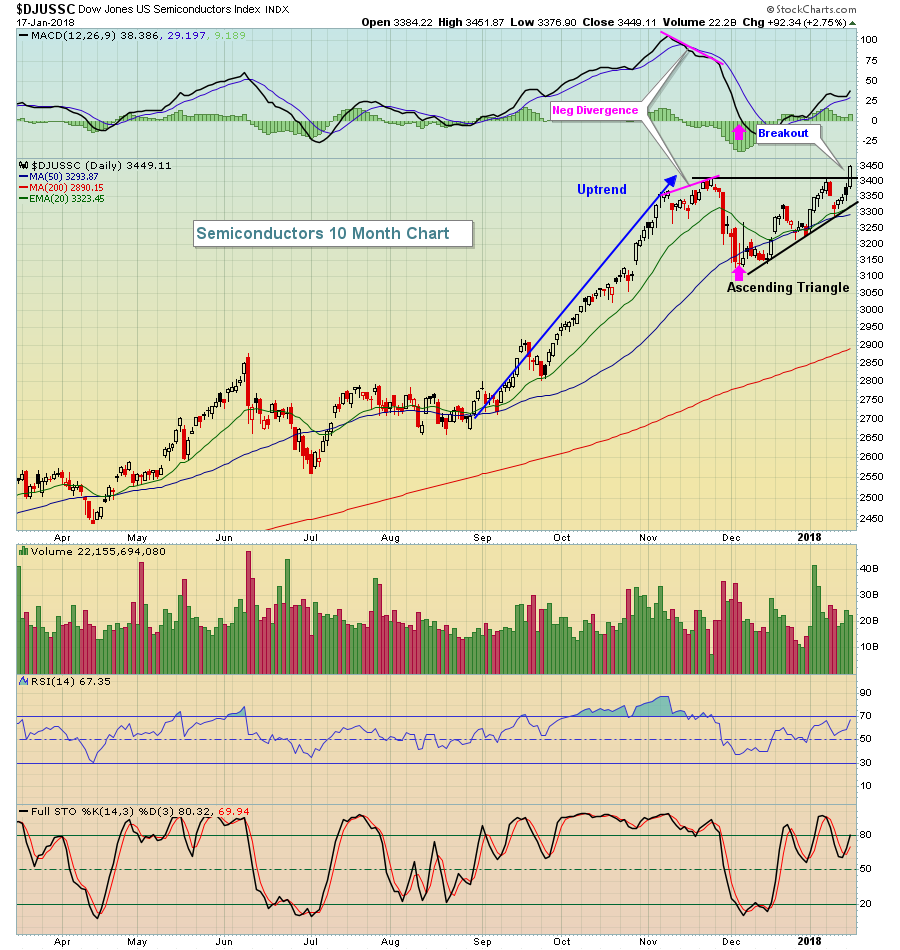 The November price high was accompanied by a lower MACD reading, or negative divergence. That typically will lead to 50 day SMA tests and/or MACD centerline tests (resets), which you can see above (pink arrows). The current breakout is quite bullish as we saw an ascending triangle pattern print during the DJUSSC's consolidation. The ascending triangle pattern is a very bullish continuation pattern that typically resolves itself with a breakout. The measurement of this pattern is from the top of the triangle to the bottom, or roughly 300 points in this case. The target on the DJUSSC is now at approximately 3700.
Historical Tendencies
The October 28th through January 18th period is the S&P 500's most bullish of the year, averaging 4.4% gains over the past 67 years. In other words, 83 calendar days out of 365 (22.7% of the year) accounts for 48.5% of the S&P 500's advance since 1950. There's been a very strong bias for stock market outperformance during this period.
There's good news and there's bad news.
The bad news is that today is January 18th and ends this historically bullish period. The good news is that the best 25% of October 28th-January 18th periods historically lead to solid outperformance over the subsequent three months (through April 18th). You might think that really strong advances would require a pause or consolidation....or even outright selling. History tells us that is not the case. In order for the October 28, 2017 to January 18, 2018 period to rank in the top 25% of all such periods since 1950, the S&P 500 must close above 2805 today. A close at 2805 would result in an 8.68% advance in the S&P 500 since the October 27th close, placing this year in the top quartile. This top quartile has produced very solid results over the subsequent three months.
Here are a couple facts surrounding these stats:
(1) From January 19th through April 18th, the S&P 500 has gained more than 10% only 8 times since 1950. 6 of those major advances belong to years that are in the top quartile of October 28-January 18 periods. Put another way, in order to see a major advance starting on January 19th, it certainly helps to begin the period in a raging bull market.
(2) The top quartile of October 28-January 18 periods have produced average returns of 5.79% over the next three months. On the flip side, those periods that fall outside the top quartile have produced average returns of just 2.10% over the next 90 days.
Key Earnings Reports
(actual vs. estimate):
BBT: .82 vs .80
BK: .91 vs .91
JBHT: 1.04 vs 1.03
KEY: .33 vs .36
MS: .84 vs .77
MTB: 2.66 vs 2.40
PPG: 1.19 vs 1.18
TSM: vs .62
(reports after close, estimate provided):
AXP: 1.54
CP: 2.57
IBM: 5.17
Key Economic Reports
December housing starts released at 8:30am EST: 1,192,000 (actual) vs. 1,280,000 (estimate)
December building permits released at 8:30am EST: 1,302,000 (actual) vs. 1,300,000 (estimate)
Initial jobless claims released at 8:30am EST: 220,000 (actual) vs. 250,000 (estimate)
January Philadelphia Fed survey released at 8:30am EST: 22.2 (actual) vs. 25.0 (estimate)
Happy trading!
Tom
