Note
At the bottom of this article, you can type in your email address and hit the green "Notify Me" button to subscribe to my blog for FREE! Then my article will immediately be sent to your email address upon publishing. Thanks!
Market Recap for Tuesday, January 9, 2018
It took quite a bit of effort for the bears to stop the bulls' winning streak, but the bulls returned the favor on Tuesday with little effort at all. Ho-hum, it was just another 100 point day for the Dow Jones. It doesn't seem to matter which sector or two take a pause as many others routinely step up to the plate. Yesterday, the bulls turned to healthcare (XLV, +1.18%) and financials (XLF, +0.78%). Pharmaceuticals ($DJUSPR) were the beneficiary of a significant price breakout in Johnson & Johnson (JNJ) as you can see below:
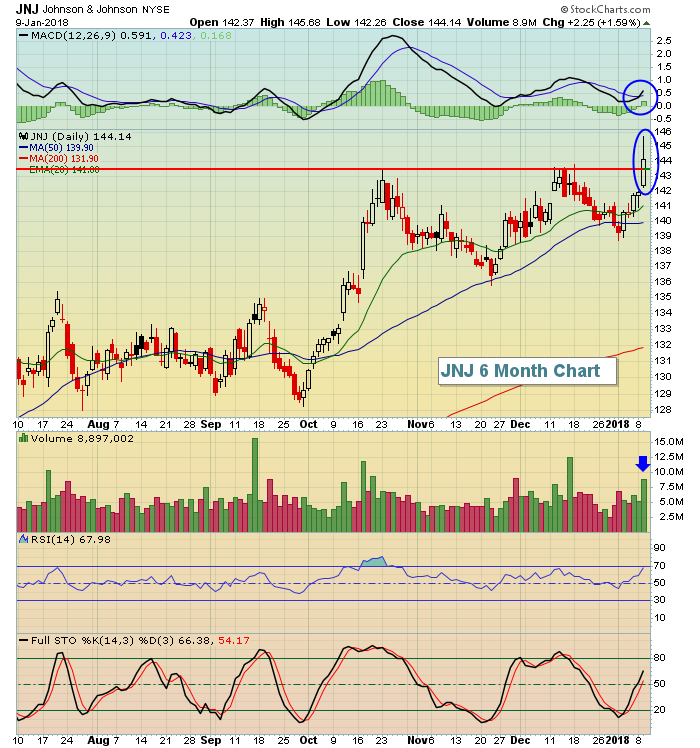 Volume accelerated and JNJ was able to confirm a fresh closing high with that accompanying volume - a bullish sign indeed. The price breakout, along with the rising 20 day EMA, should provide excellent support on future pullbacks or periods of consolidation. Despite the huge move higher in JNJ shares in October, the DJUSPR has yet to make a key breakout, but very well could in 2018, which would be extremely bullish for both the DJUSPR and JNJ. The longer-term DJUSPR chart can be found below in the Sector/Industry Watch section.
Financials had a very strong day on Tuesday, thanks in large part to a 10 year treasury yield ($TNX) that broke above 2.50% for the first time since March. Higher treasury yields typically result in strong advances for both banks ($DJUSBK, +0.82%) and life insurance ($DJUSIL, +0.93%), the latter of which closed at a fresh all-time high on Tuesday.
Pre-Market Action
Asian markets were mixed overnight and that bifurcation continues in Europe this morning. The German DAX ($DAX) is down 120 points to 13,265 at last check and that represents a 0.90% decline. This global pause/weakness coincides with a report that China may slow or halt its purchases of U.S. treasuries. That's led to early morning weakness in treasuries with the 10 year treasury yield ($TNX) rising to nearly 2.60%. 2.62% was the 3+ year high established in March 2017. Breakouts in treasury yields tend to be very bullish events for U.S. equities, although there's always the need to evaluate the reason. If China actually did halt its buying of treasuries, the Fed's plan to reduce its balance sheet by selling treasuries might become a bit more interesting and not quite as seamless as they hoped. Apparently, lots of traders are concerned this morning and selling now and asking questions later.
Dow Jones futures are lower by 96 points with just 30 minutes left to the opening bell.
Current Outlook
Higher treasury yields = selling of treasuries. Selling of treasuries = proceeds that typically get reinvested in equities. Reallocation of funds from the bond market to the stock market = exactly what we've been witnessing for the past several months, a raging bull market in equities. Economic reports have been mostly strong and/or strengthening since mid-summer and that economic strength is sending money from the bond market to the stock market. I see it continuing in 2018. Here's a chart that compares the TNX to the benchmark S&P 500:
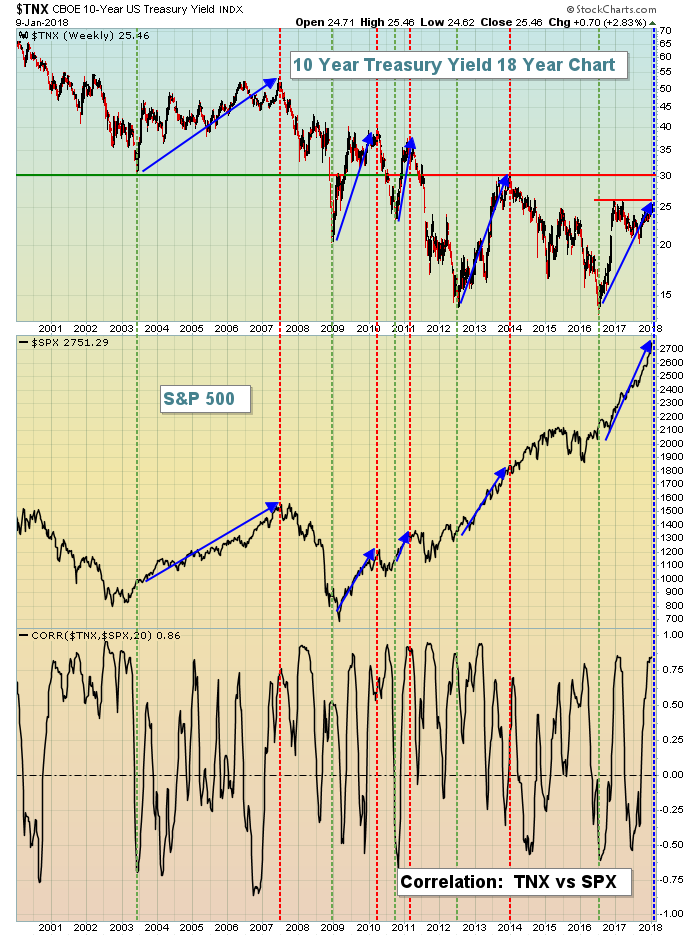 The blue directional arrows really says it all. When we experience a period of rising treasury yields, the stock market explodes. This chart dates back to 2000 and through two bear markets. The really interesting part is when treasury yields are declining. The S&P 500 either downtrends in a bear market or struggles just to stay flat with increased volatility. The relationship between the bond market and the stock market is a must understand for everyone that invests in the stock market.
The correlation above is mostly above zero and spends considerable time at or near 1, suggesting a very strong positive correlation between the direction of the TNX and the direction of the S&P 500. There are periods when the S&P 500 rises while the TNX declines, which is easily explained. New money coming into equities can send the S&P 500 higher. Strength in the S&P 500 doesn't only come from money rotating from bonds. But history tells us that when the TNX is rising, the S&P 500 soars.
The moral of this story? Watch TNX resistance at 2.62%. If we see a breakout, it'll likely mean another huge advance in the S&P 500 in 2018, despite the already overbought conditions.
Sector/Industry Watch
Pharmaceuticals ($DJUSPR) could be on the brink of a major long-term breakout that could lead to significant outperformance during the balance of 2018 and perhaps beyond. The group has based for the past few years and historically when a long basing period finally breaks, it tends to launch that group in a major uptrend for a period of weeks, months and sometimes even years. Here's a visual of the basing that has taken place:
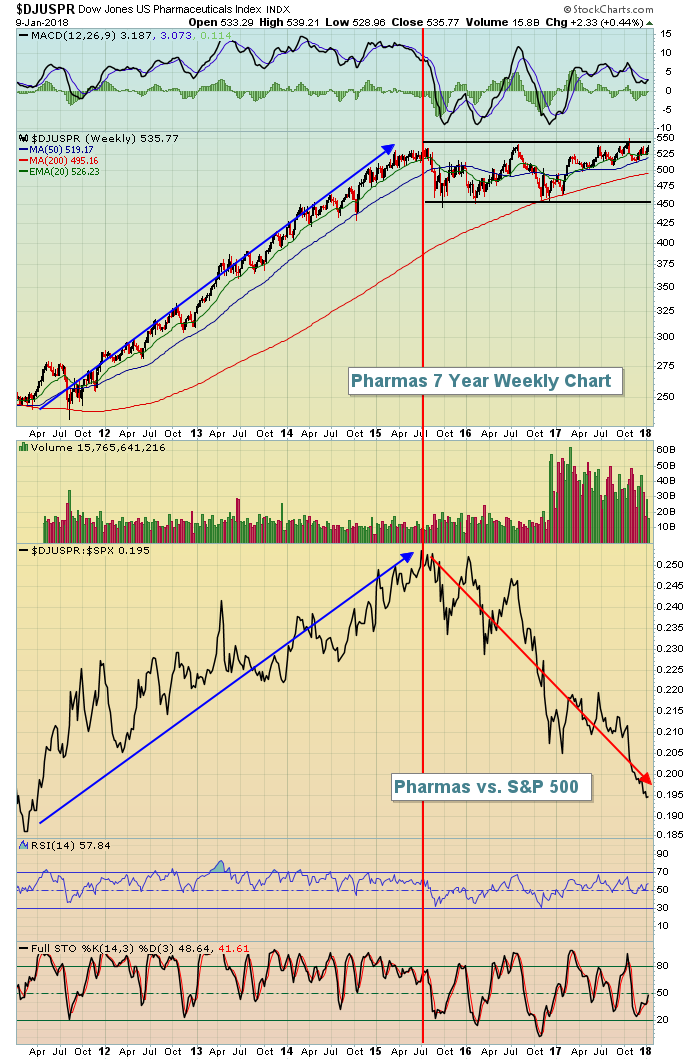 On an absolute basis, I view pharmas quite bullishly. After a significant uptrend, we've been consolidating in sideways fashion. I view this as a very bullish continuation pattern with the expectation we'll see a breakout. It's been awhile and many traders have short-term memories, but pharmas were huge outperformers until 2015. They led for a long time and deserved a break technically. That's resulted in significant underperformance as the S&P 500 has soared on the backs of many other sectors and industry groups. But 2018 could be pharmas time to shine.
Historical Tendencies
Looking ahead, the S&P 500 (since 1950) has produced annualized returns for each of the upcoming calendar months as follows:
February: +1.33% (ranks 9th among all 12 calendar months)
March: +14.58% (ranks 4th)
April: +17.06% (ranks 3rd)
Key Earnings Reports
(actual vs. estimate)
LEN: 1.29 vs 1.50
Key Economic Reports
December wholesale trade to be released at 10:00am EST: +0.7% (estimate)
Happy trading!
Tom
